Zilliqa Price Analysis: ZIL correction seems imminent following a remarkable week
- Zilliqa’s uptrend has hit the tipping point due to the seller congestion at $0.036.
- A sell signal on the 4-hour chart doubles down on the anticipated breakdown.

Zilliqa seems poised to correct after sustaining an uptrend from the support at $0.022. The token has encountered a robust resistance area at $0.036 in addition to the ascending parallel channel’s upper boundary. Selling pressure is likely to increase at the current price levels, leading to a breakdown, perhaps to $0.03.
Zilliqa is on the cusp of a massive correction
ZIL/USD is teetering at $0.035 amid a bearish building momentum. Its immediate upside is limited by the immense seller congestion at $0.036. Besides, buyers appear to be exhausted due to the failure to rise above the channel’s upper boundary.
The Relative Strength Index brings to light the possibility of the correction catching momentum as it points downwards. The downtrend will be validated if Zilliqa falls under the middle boundary. Support is anticipated at the 50 Simple Moving Average and the lower border.
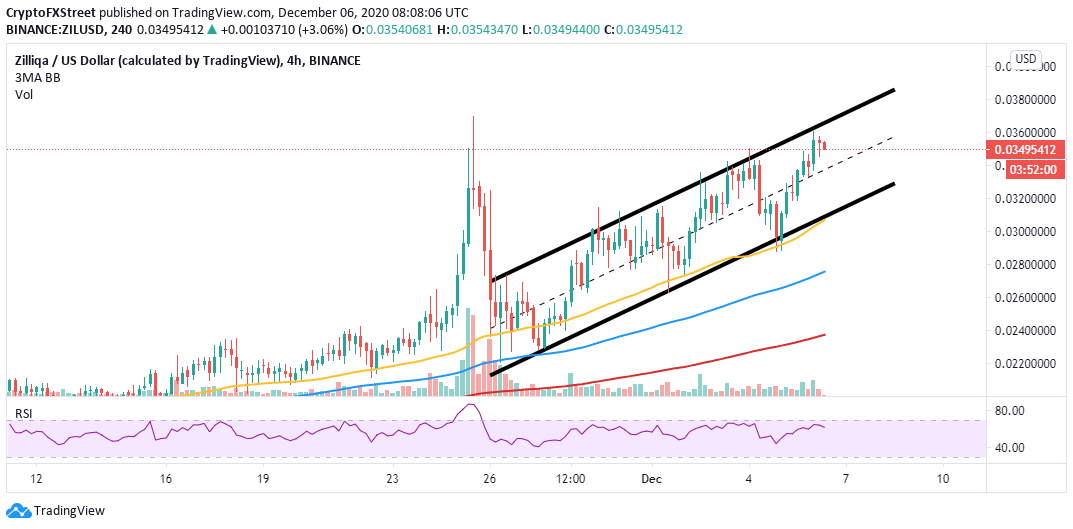
ZIL/USD 4-hour chart
The TD Sequential indicator has presented a sell signal on the 4-hour chart. The signal manifested in a green nine candlestick. If validated like the previous call to sell, Zilliqa might spiral in one to four candles. On the other hand, if the ZIL supply rises significantly, a sharp and extensive downtrend will come into the picture.
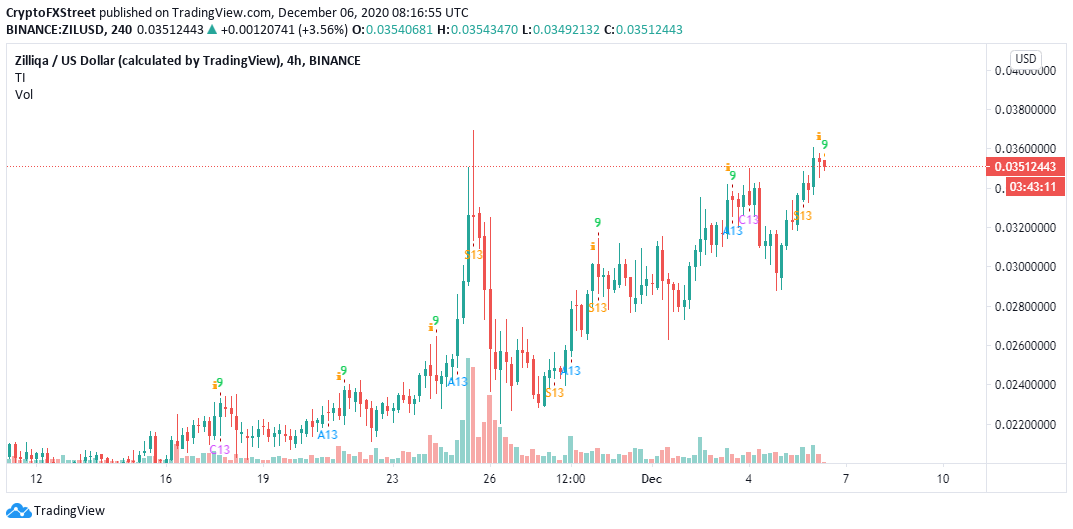
ZIL/USD 4-hour chart
It is worth noting that the expected bearish outlook will be abandoned if Zilliqa closes the day above the middle boundary of the ascending channel. A reversal past the upper limit will pave the way for gains beyond $0.04, pulling ZIL/USD to higher price levels.
Author

John Isige
FXStreet
John Isige is a seasoned cryptocurrency journalist and markets analyst committed to delivering high-quality, actionable insights tailored to traders, investors, and crypto enthusiasts. He enjoys deep dives into emerging Web3 tren


