|

Zilliqa Price Prediction: ZIL breaks out of multi-year bullish pattern suggesting a 1,000% upswing

  • Zilliqa price seems to be contained inside an inverse head-and-shoulders pattern on the weekly chart.
  • ZIL is breaking out and aims for a massive price target at $0.3.

Zilliqa has been trading fairly sideways for the past six months and seems to be finally breaking out of a significantly bullish trading pattern. Several metrics indicate ZIL is on the verge of a massive price move.

Zilliqa price breaks out of a significant bullish pattern

On the weekly chart, ZIL formed an inverse head-and-shoulders pattern, which is a bullish pattern. The neckline resistance trendline was broken on November 23, and Zilliqa price has already re-tested it in the past week, successfully defending it.

zil price

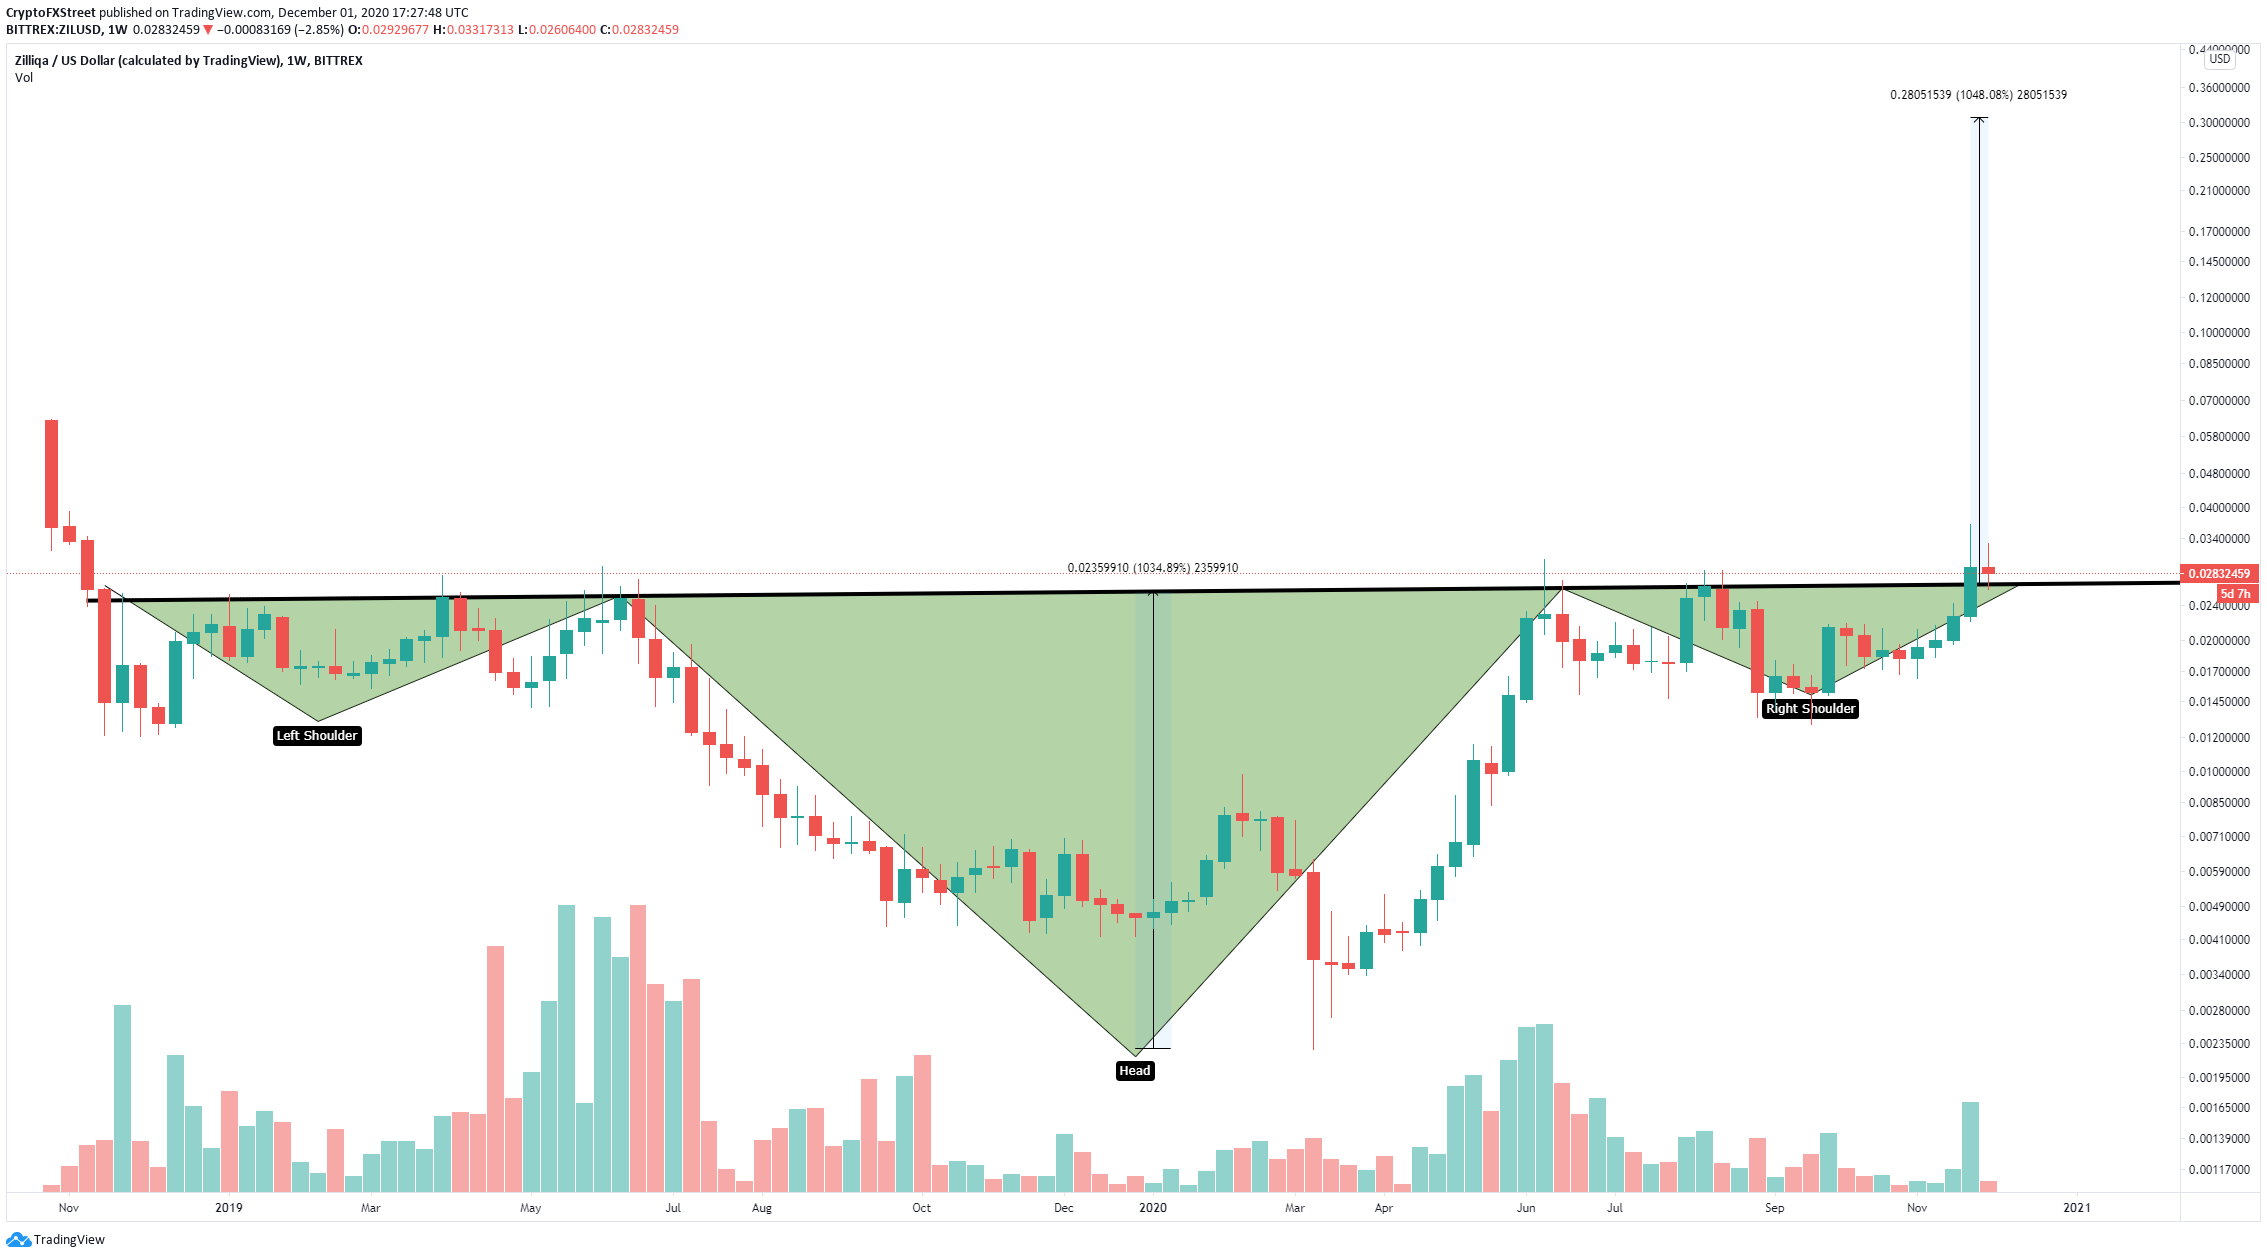
ZIL/USD weekly chart

Using the height of the head to the neckline as a reference, it seems that Zilliqa price is aiming for a massive price target at $0.3, which would mean a 1,000% increase from the breakout at $0.027. 

zil price

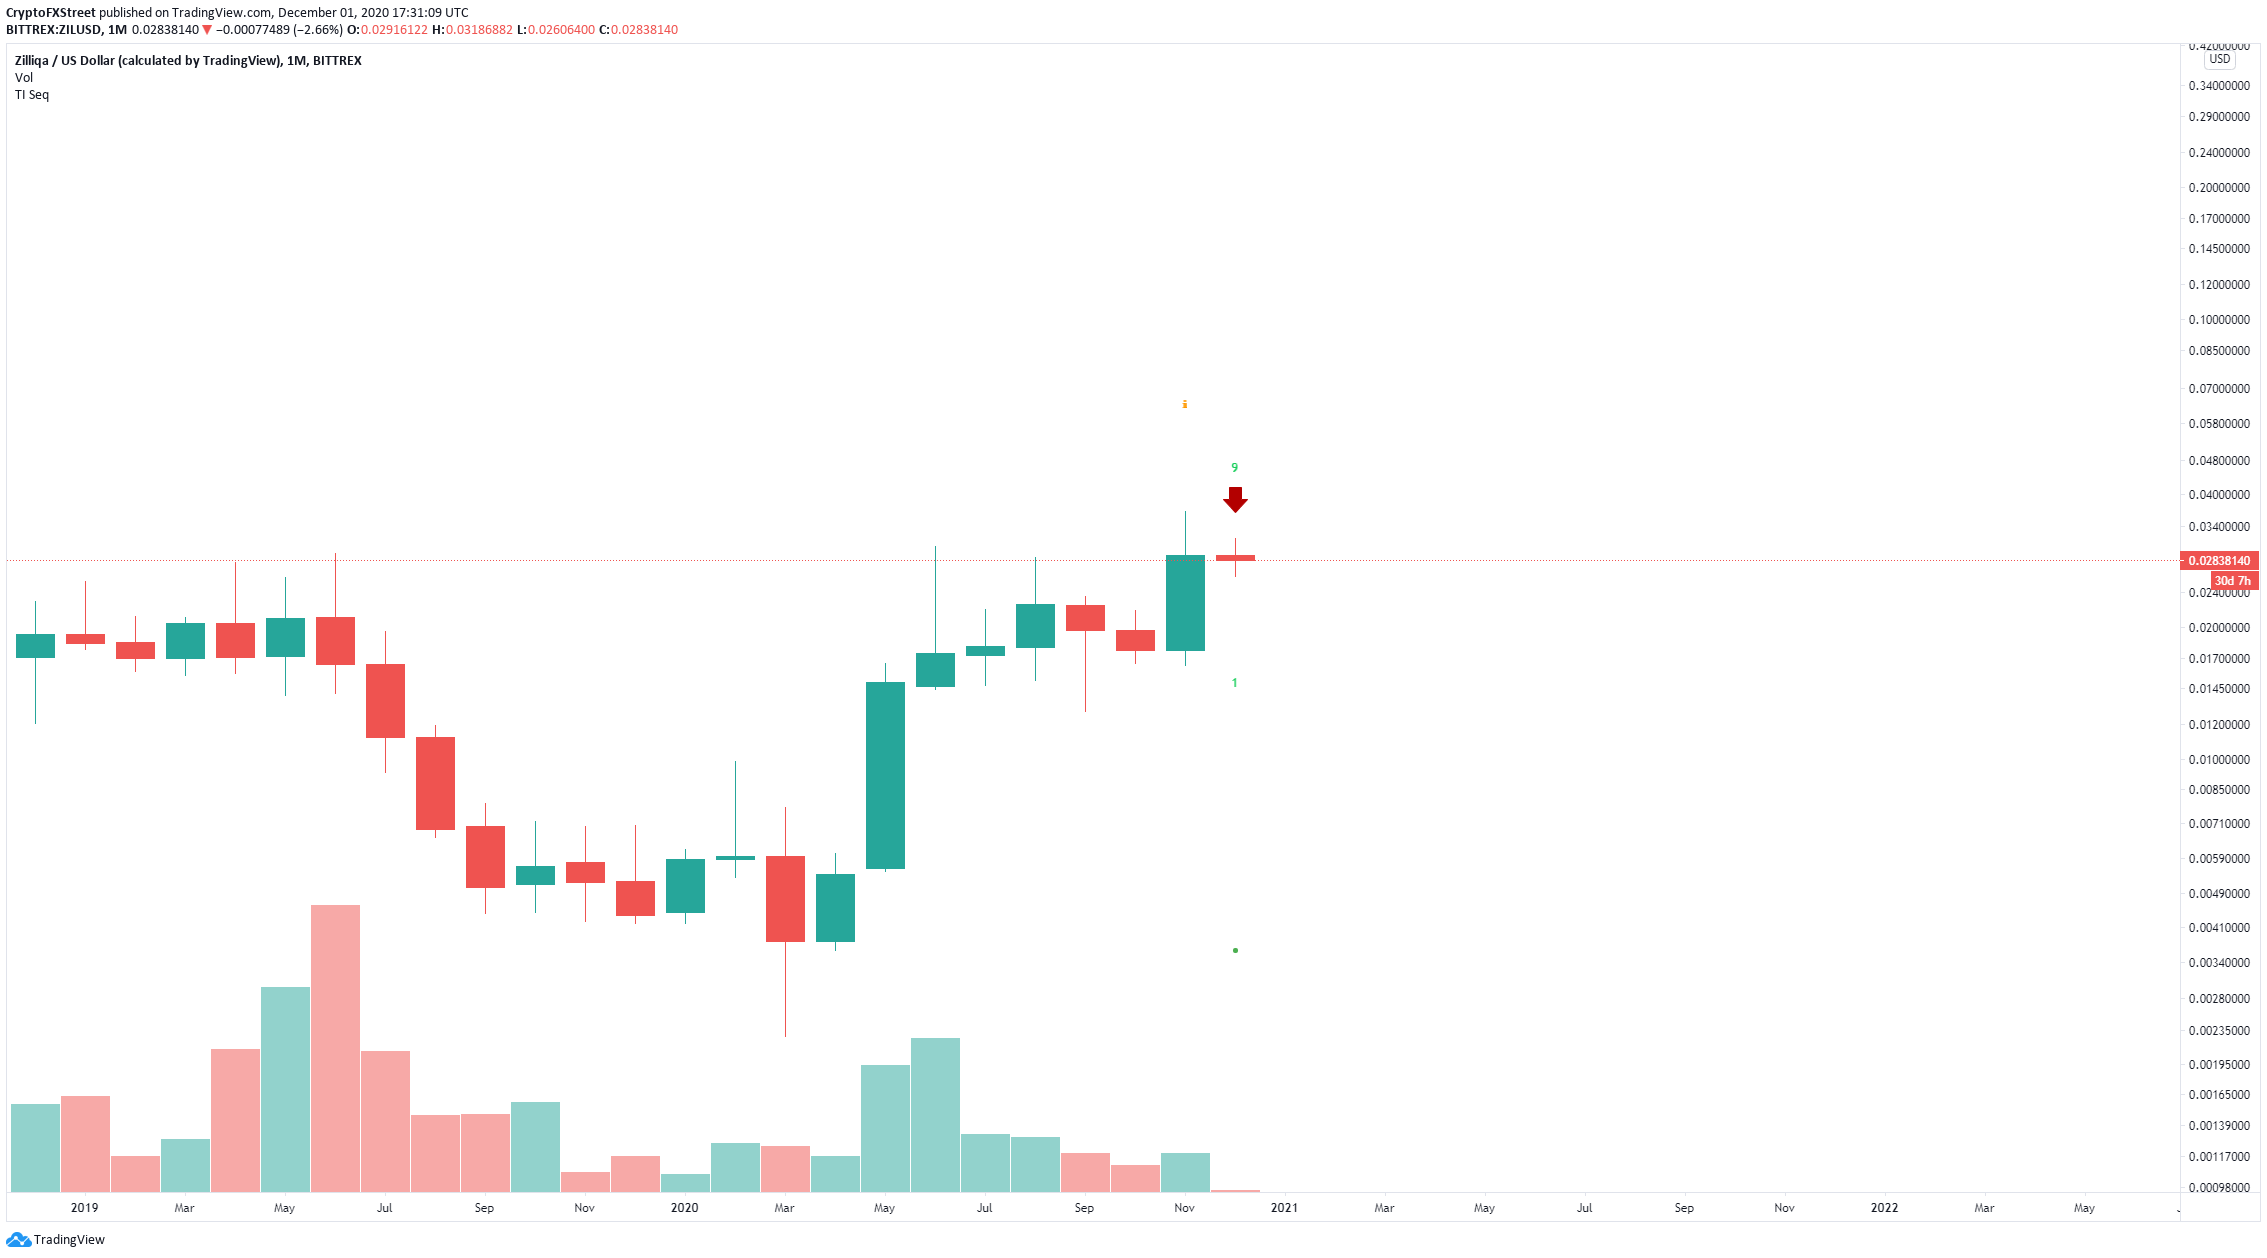
ZIL/USD monthly chart

However, despite the bullish pattern, the TD Sequential indicator has still presented a sell signal on the monthly chart. Validation of the signal could quickly drive Zilliqa price to $0.02 if the neckline support level at $0.027 is broken.

Author

Lorenzo Stroe

Lorenzo Stroe

Independent Analyst

Lorenzo is an experienced Technical Analyst and Content Writer who has been working in the cryptocurrency industry since 2012. He also has a passion for trading.

More from Lorenzo Stroe
Share:

Editor's Picks

Crypto Today: Bitcoin, Ethereum, XRP lag recovery as Israel and Iran attack each other

Cryptocurrency prices remain under pressure on Monday as market participants navigate tensions in the Middle East after Israel and Iran attacked each other for the first time since the peace deal agreement that was reached in Early April.

Bitcoin Price Forecast: Institutional selling, Middle East tensions keep BTC under pressure

Bitcoin remains under pressure, struggling below $64,000 on Monday after posting its worst one-week return this year. Institutional sell-off remains severe with spot Exchange Traded Funds recording the fourth week of steady outflows of billions since mid-May.

Hyperliquid rebounds as retail interest offsets first-ever ETF outflows

Hyperliquid price is up 6% at press time on Monday, extending the 5% rebound from the previous day. The rebound aligns with HYPE's regaining retail strength in the derivatives market, offsetting the first-ever daily outflows from Exchange-Traded Funds.

Pi Network extends bearish trend as low volumes stall recovery

Pi Network (PI) price hovers below $0.1300 at press time on Monday, following its sixth consecutive weekly loss of 12%. A declining trend in trading volume shadows the falling PI token prices, reflecting weak demand failing to absorb supply pressure.

Bitcoin: After the bloodbath, everyone looks at $60,000
Bitcoin (BTC) hovers above $62,000 at the time of writing on Friday, weighed down by growing risk-off sentiment due to persistent geopolitical tensions in the Middle East and sticky macroeconomic uncertainty. The institutional sell-off continued to wreak havoc on capital flows, with spot Bitcoin Exchange-Traded Funds (ETFs) recording billions in outflows.