|

XRP/USD technical analysis: Ripple takes a massive dive below the 0.4000 figure
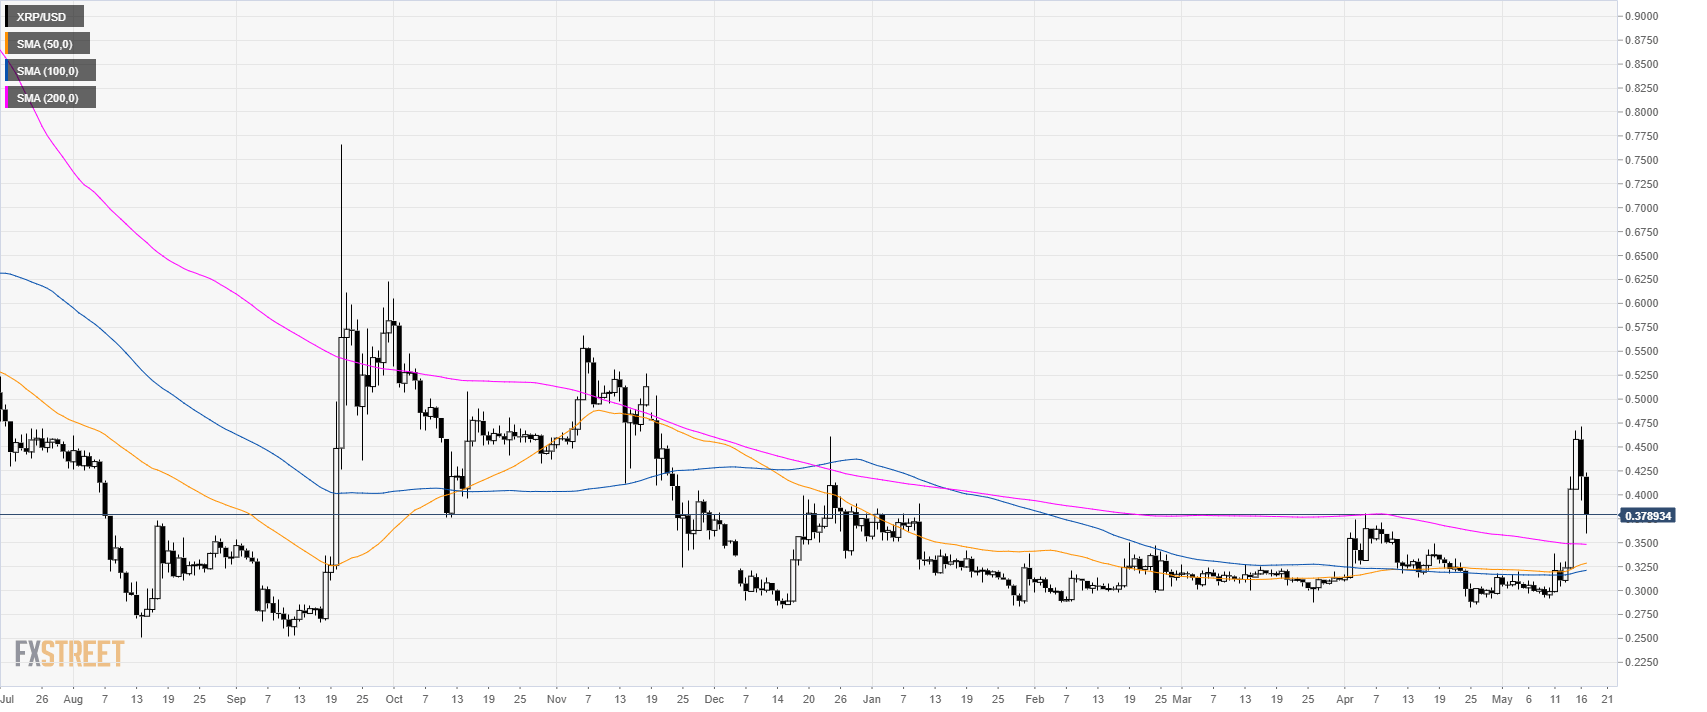
XRP/USD daily chart

XRP/USD is correcting the bullish breakout the market had earlier in the week. 

XRP/USD 4-hour chart

XRP/USD is in consolidation mode above its main simple moving averages (SMAs). 

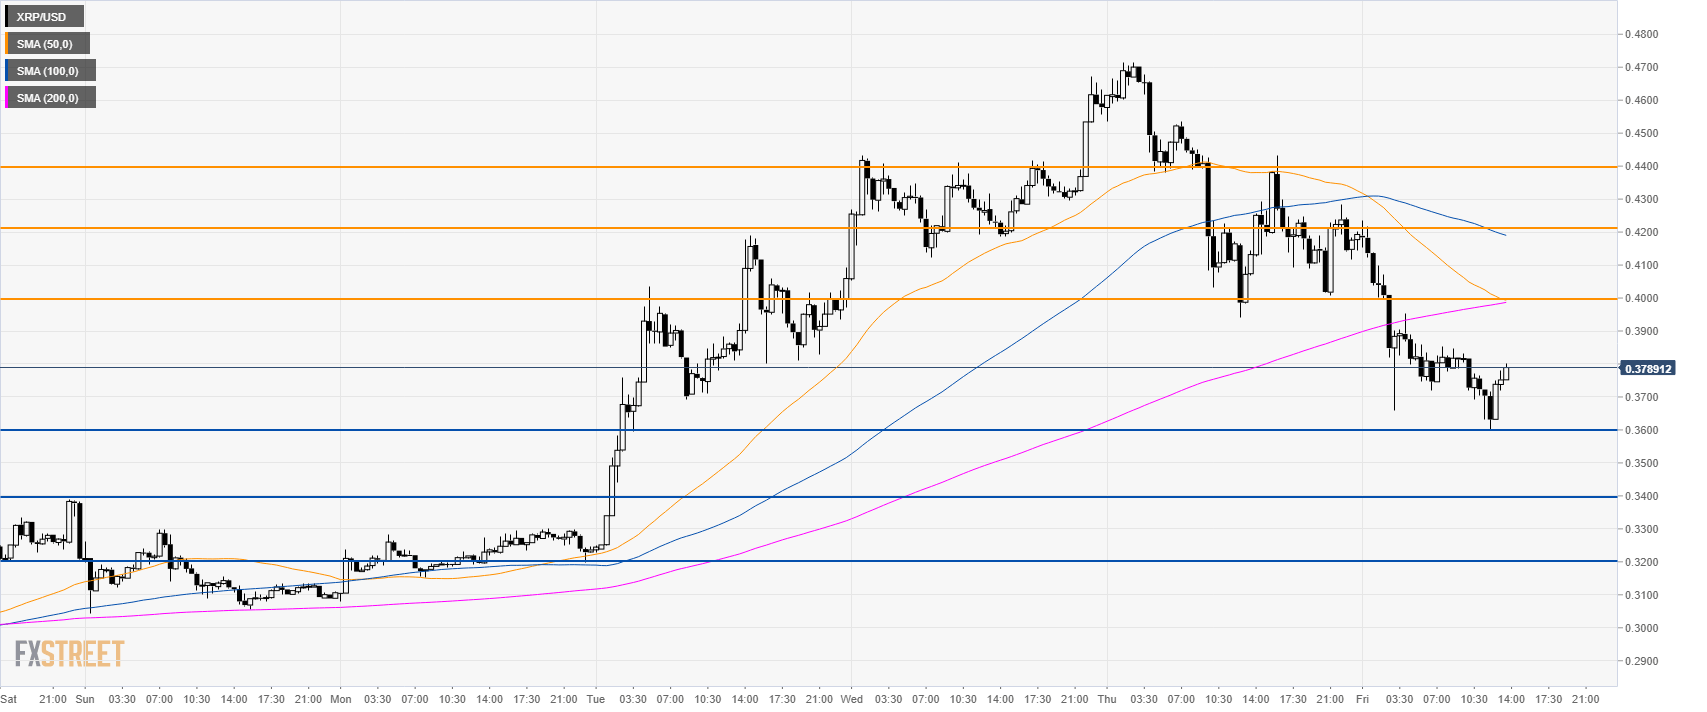
XRP/USD 30-minute chart

Ripple is trading below its main SMAs suggesting a bearish bias in the short term. The market is seen consolidating in the 0.3600 -0.4000 range. If bears can break 0.3600 then support is seen at 0.3400 and the 0.3200 price levels. Resistance is at 0.4000, 0.4200 and the 0.4400 levels.   

Additional key levels

XRP/USD

Overview
Today last price0.3779
Today Daily Change-0.0414
Today Daily Change %-9.87
Today daily open0.4193
 
Trends
Daily SMA200.3239
Daily SMA500.3272
Daily SMA1000.3202
Daily SMA2000.3483
Levels
Previous Daily High0.4716
Previous Daily Low0.3942
Previous Weekly High0.3107
Previous Weekly Low0.2917
Previous Monthly High0.3803
Previous Monthly Low0.2827
Daily Fibonacci 38.2%0.4238
Daily Fibonacci 61.8%0.442
Daily Pivot Point S10.3852
Daily Pivot Point S20.351
Daily Pivot Point S30.3078
Daily Pivot Point R10.4625
Daily Pivot Point R20.5057
Daily Pivot Point R30.5398

Author

Flavio Tosti

Flavio Tosti

Independent Analyst


More from Flavio Tosti
Share:

Editor's Picks

Ripple bulls defend key support amid waning retail demand and ETF inflows

XRP ticks up above $1.40 support, but waning retail demand suggests caution. XRP attracts $4 million in spot ETF inflows on Thursday, signaling renewed institutional investor interest.

Crypto Today: Bitcoin, Ethereum, XRP rebound as risk appetite improves

Bitcoin rises marginally, nearing the immediate resistance of $68,000 at the time of writing on Friday. Major altcoins, including Ethereum and Ripple, hold key support levels as bulls aim to maintain marginal intraday gains.

Bitcoin Weekly Forecast: No recovery in sight 

Bitcoin price continues to trade sideways between $65,729 and $71,746, extending its consolidation since February 7. US-spot ETFs record an outflow of $403.90 million through Thursday, pointing to the fifth consecutive week of withdrawals.

Pi Network Price Forecast: PI recovery stalls amid profit-taking

Pi Network tests 50-day EMA support on Friday, after a 5% decline the previous day. PiScan data shows large deposits on CEXs totaling over 4 million PI tokens in the last 24 hours, reflecting an exodus of investors taking profits.

Bitcoin Price Annual Forecast: BTC holds long-term bullish structure heading into 2026

Bitcoin (BTC) is wrapping up 2025 as one of its most eventful years, defined by unprecedented institutional participation, major regulatory developments, and extreme price volatility.

Bitcoin: No recovery in sight

Bitcoin (BTC) price continues to trade within a range-bound zone, hovering around $67,000 at the time of writing on Friday, and falling slightly so far this week, with no signs of recovery.