XRP/USD Elliott Wave technical analysis [Video]
![XRP/USD Elliott Wave technical analysis [Video]](https://editorial.fxsstatic.com/images/i/XRP-neutral-object_XtraLarge.png)
XRP/USD daily chart – Elliott Wave count
-
Function: Trend.
-
Mode: Motive.
-
Structure: Impulse.
-
Position: Wave 3 of 3.
-
Direction: Ongoing Uptrend.

Analysis details
-
The internal wave count is structured clearly: Wave 1 – Double Zigzag Wave 2 – Developing Wave 3.
-
Wave 2 retraced to a low of $1.9095, establishing the correction base.
-
Wave 3 is progressing with strong momentum, breaking above Wave 1's high ($2.6623).
-
Next Fibonacci resistance levels:
-
0.236 = $3.2392.
-
0.382 = $2.9994.
(These levels may act as a short-term pullback area within Wave 3).
-
Trading strategy
- For short-term traders (swing trade):
-
If holding, consider partial profit-taking near $4.20.
-
Use a “Buy the Dip” approach by waiting for a Wave 4 retracement before entering Wave 5.
-
-
Invalidation point:
-
If the price drops below $2.23, the current Elliott Wave count will need reevaluation.
-
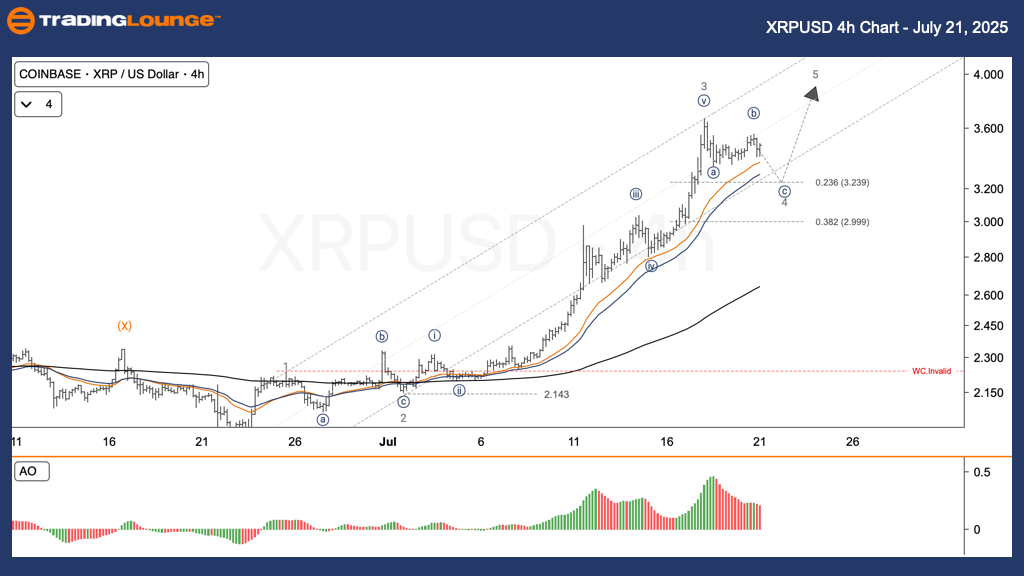
XRP/USD four-hour chart – Elliott Wave count
-
Function: Counter Trend.
-
Mode: Corrective.
-
Structure: Zigzag.
-
Position: Wave 4 of 3.
-
Direction: Corrective within an Uptrend.
Analysis details
-
Wave (1) to (5) within Wave 3 is now completed.
-
Price is consolidating to form Wave 4.
-
Key consolidation zones:
-
0.236 Fib retracement = $3.2392.
- 0.382 Fib retracement = $2.9994.
-
(These levels suggest a possible entry for Wave 5 if price holds in this range)
Trading strategy:
-
For short-term traders (swing trade):
- Holding positions? Consider profit-taking around $4.20.
- Use the “Buy the Dip” strategy – wait for Wave 4 pullback before entering Wave 5.
-
Invalidation point:
- If price falls below $2.23, wave structure must be reassessed.
XRP/USD Elliott Wave technical analysis [Video]
Author

Peter Mathers
TradingLounge
Peter Mathers started actively trading in 1982. He began his career at Hoei and Shoin, a Japanese futures trading company.


