XRP price fortifies rebound while rumors of a Ripple IPO surface
- XRP price sketching a bullish inverse head-and-shoulders pattern on the intra-day charts.
- All key moving averages remain in uptrends, supporting rebound continuity.
- Ripple investor endorses rumors of Ripple going public after SEC case resolution.

XRP price has been a wild ride in April, beginning with a rally of nearly 250%, followed by a 50% crash, and now a 60% rebound. Chart technicals have been tossed around like a salad, but Ripple now appears to calmly consolidate the price compression, upgrading the long-term bullish outlook.
XRP price volatility spotlights the hazards of a cryptocurrency wrapped in legal uncertainty
During an earnings presentation call, Yoshitaka Kitao, CEO of the Japanese financial juggernaut SBI Group, rekindled the rumors of Ripple executives contemplating an initial public offering (IPO) once the Securities and Exchange Commission (SEC) lawsuit is settled.
Last year Ripple executive Brad Garlinghouse hinted at an IPO.
In the next 12 months, you’ll see IPOs in the crypto/blockchain space. We’re not going to be the first and we’re not going to be the last, but I expect us to be on the leading side. It’s a natural evolution for our company.
An IPO would be a big boost to SBI Groups’ financial fortunes, considering they are the largest outside shareholder of Ripple. Kitao predicted such an IPO would trigger interest in other SBI Group investments, such as blockchain consortium R3, to go public in the future.
For now, under the stress of the SEC case, Ripple executives are focused on securing legal victories and increasing the adoption of the cross-border remittances token outside of the United States.
Last week, Ripple closed down 26.41% for the largest weekly loss since the SEC case was first made public. The overall loss from the April high was 55%.
XRP price responded impressively with a 30% gain on April 26, shattered the declining trend line from the April high, and achieved a 60% in five days. Over the last two days, Ripple has shifted into a process of consolidation that slowly reveals an inverse head-and-shoulders pattern.
A breakout from the bottoming pattern would strike resistance at the 61.8% Fibonacci retracement of the April decline and the 78.6% retracement at $1.73. However, the psychologically important $2.00 and the 61.8% retracement of the 2018-2020 bear market at $2.08 are what seizes the attention of bullish Ripple speculators.
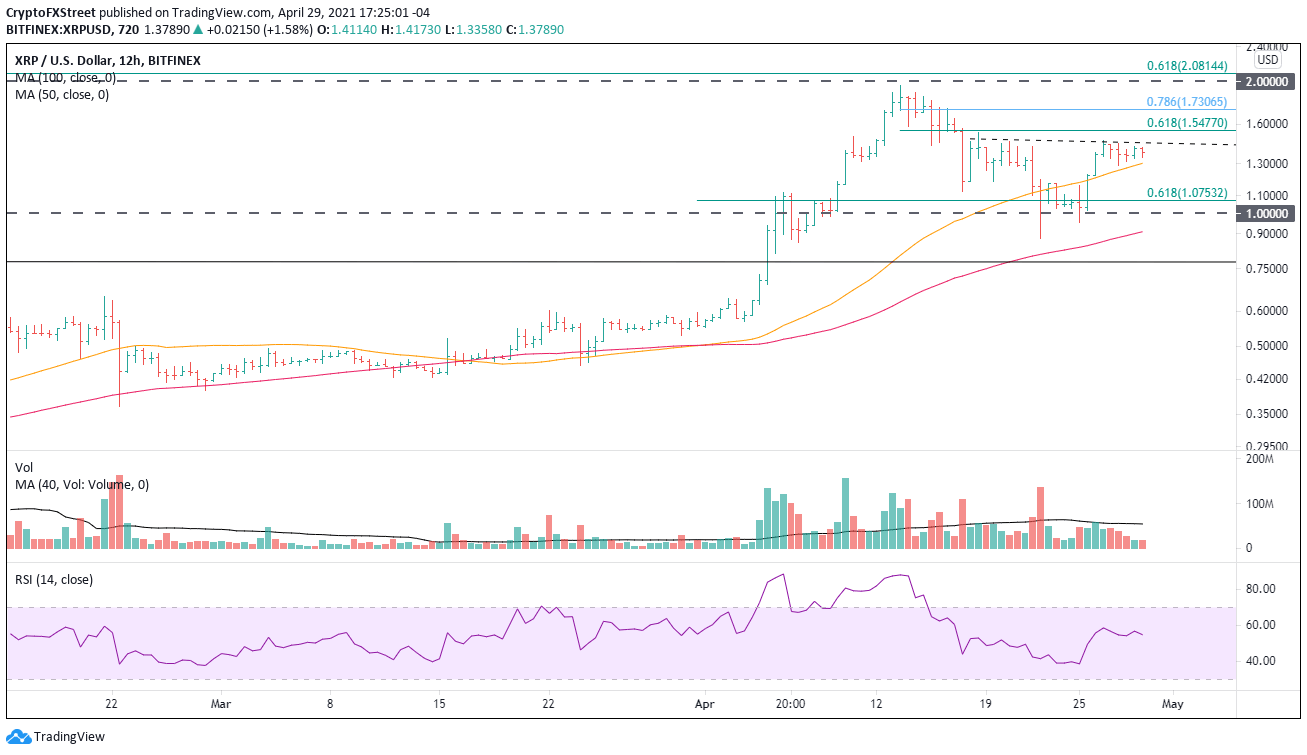
XRP/USD 12-hour chart
The bullish outlook could be complicated by a restart of the collective decline in the cryptocurrency complex or a negative development in the SEC lawsuit. Some support will manifest around the 50 twelve-hour moving average at $1.30, but the legitimate support does not arrive until $1.00.
An incremental rally underpins the bullish outlook, but there is no room for underestimating the volatility of Ripple. Staging entries with discipline and elevating risk management to the forefront is the right investment program for the digital token.
Author

Sheldon McIntyre, CMT
Independent Analyst
Sheldon has 24 years of investment experience holding various positions in companies based in the United States and Chile. His core competencies include BRIC and G-10 equity markets, swing and position trading and technical analysis.




