XRP Elliott Wave technical analysis [Video]
![XRP Elliott Wave technical analysis [Video]](https://editorial.fxsstatic.com/images/i/XRP-neutral-object.png)
Elliott Wave Analysis TradingLounge
XRP/ U.S. dollar(XRPUSD)
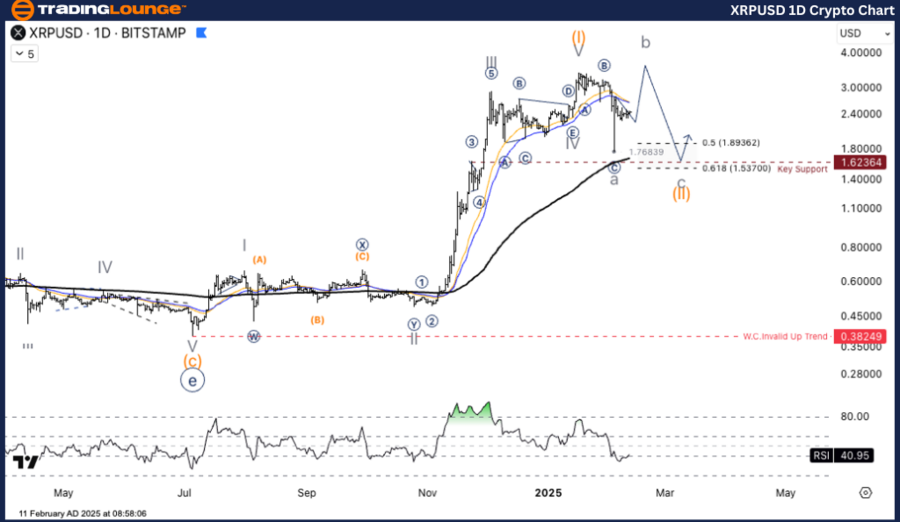
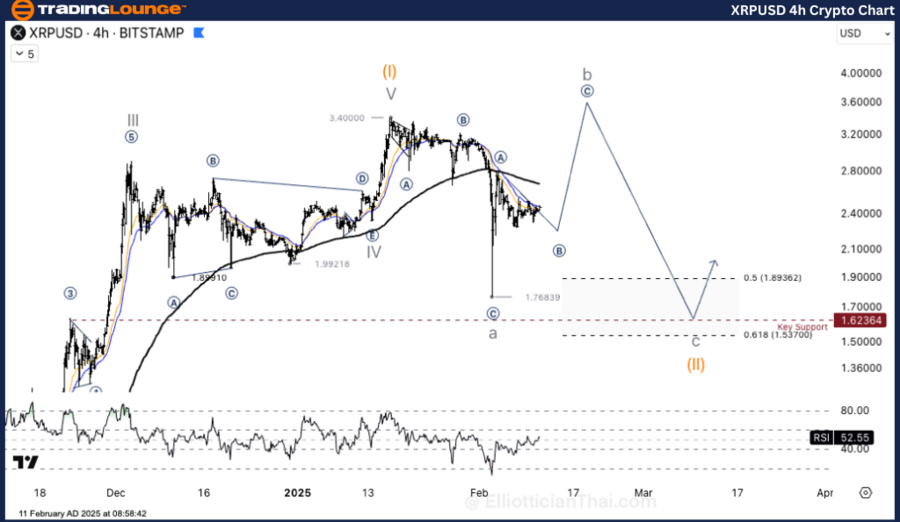
XRP/USD Elliott Wave technical analysis
Function: Counter Trend
Mode: Corrective
Structure: Flat
Position: Wave ((B))
Direction next higher degrees: Wave IV
Wave Cancel invalid level:
XRP/USD trading strategy: XRP is in wave II correction after the end of wave I. ABC Flat correction wave is expected to fall to the Key Support (1.62364 USD). If the price reverses from the support, it could be the start of wave III.
Trading strategies
Buy strategy (long position):
- Wait for a reversal signal after the price has adjusted down to 1.62364 - 1.53700 USD.
Risk management:
- If the price breaks the support level of 1.53700 USD, a new lower support level may need to be considered.
XRP/USD Elliott Wave technical analysis
Function: Counter Trend.
Mode: Corrective.
Structure: Flat.
Position: Wave ((B)).
Direction next higher degrees: Wave IV.
Wave cancel invalid level:
XRP/USD trading strategy: XRP is in wave II correction after the end of wave I. ABC Flat correction wave is expected to fall to the Key Support (1.62364 USD). If the price reverses from the support, it could be the start of wave III.
Trading strategies
Buy strategy (long position):
- Wait for a reversal signal after the price has adjusted down to 1.62364 - 1.53700 USD.
Risk management:
- If the price breaks the support level of 1.53700 USD, a new lower support level may need to be considered.
XRP Elliott Wave technical analysis [Video]
Author

Peter Mathers
TradingLounge
Peter Mathers started actively trading in 1982. He began his career at Hoei and Shoin, a Japanese futures trading company.


