XLM Price Prediction: Stellar could slide 45% as major red flags evolve
- XLM price has formed a rising wedge pattern on the daily chart, hinting at a correction soon.
- Although Stellar breached the bearish setup, a secondary confirmation will come if the $0.38 level is breached.
- A bullish scenario could evolve if the altcoin forms a higher high above $0.51.

XLM price looks primed for a downtrend as it sliced through a bearish pattern.
XLM price hangs in the balance
XLM price has been on a massive upswing creating distinctive higher highs and higher lows since late November 2020. A rising wedge pattern forms when the reaction highs and lows are connected using trendlines.
This technical setup forecasts a 45% downswing determined by measuring the distance between the first swing high and low and adding it to the breakout point at $0.40. This target puts XLM at $0.22.
Supporting this bearish outlook is the SuperTrend indicator’s sell signal.
Although Stellar price sliced through the bearish pattern recently, it is prudent to wait for secondary confirmation. A decisive close below $0.37 will create a lower low and kickstart a 40% downswing.
However, it is worth noting that the stable support barrier at $0.30 could rescue XLM price from the bears. This price point coincides with the 78.6% Fibonacci retracement level and the 100 one-day moving average (MA).
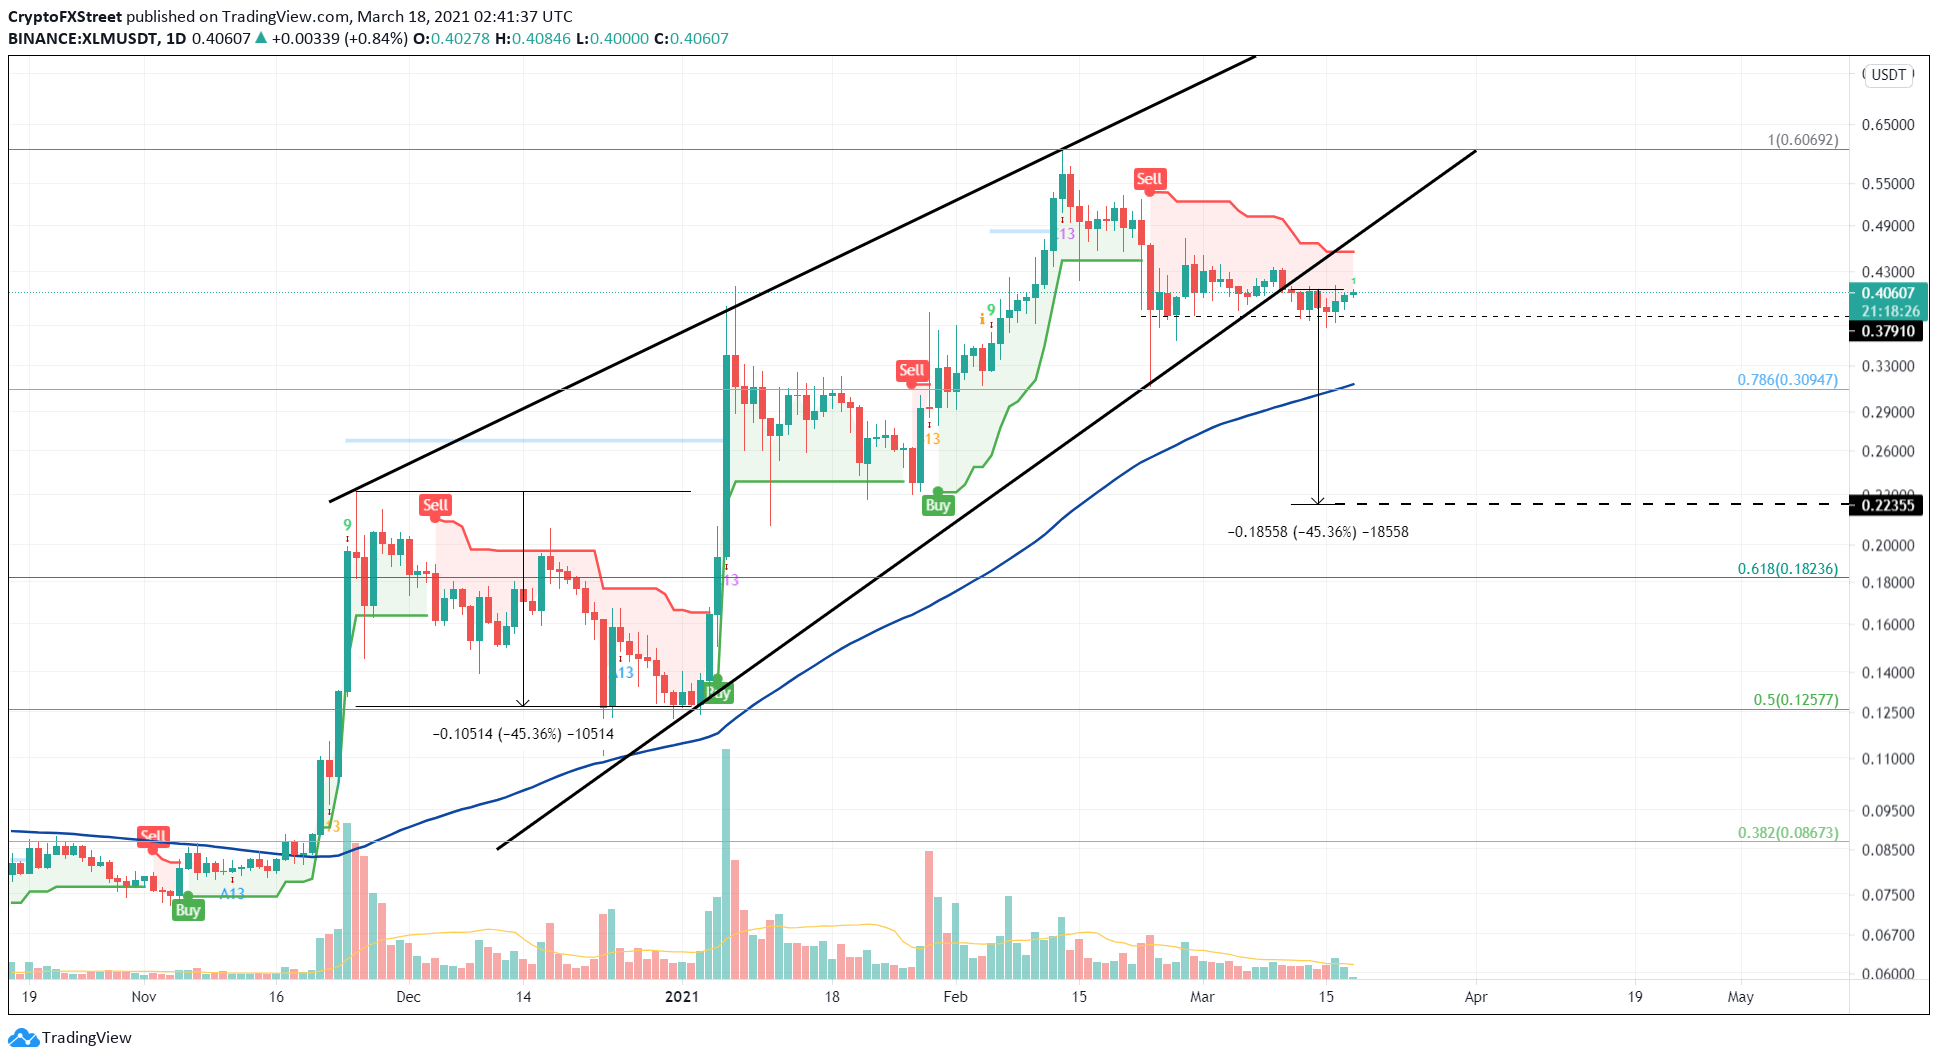
XLM/USDT 1-day chart
On the flip side, if XLM price fails to produce a lower low, the bearish confirmation will not come. Additionally, the scales will tip in bulls’ favor if the remittances token creates a higher high above $0.51.
Such a move will not only invalidate the bearish thesis but could also allow the bulls to regain control and push XLM price to retest the local top at $0.60.
Author

Akash Girimath
FXStreet
Akash Girimath is a Mechanical Engineer interested in the chaos of the financial markets. Trying to make sense of this convoluted yet fascinating space, he switched his engineering job to become a crypto reporter and analyst.


