Stellar Price Forecast: XLM is on the verge of a 50% move
- Stellar price is contained inside a symmetrical triangle pattern on the 12-hour chart.
- The digital asset faces one key resistance level before a potential 48% breakout.
- XLM could also plummet down to $0.19 if critical support fails to hold.

Stellar has been trading sideways for the past two weeks, trying to figure out its next major move. The digital asset is contained between two key levels, and it's on the verge of bursting.
Stellar price on the brink of a huge move
On the 12-hour chart, Stellar has established a symmetrical triangle pattern that is about to burst. There are two key levels to watch out for, $0.402, which coincides with the 100-SMA as the resistance, and $0.37 as the support trendline.
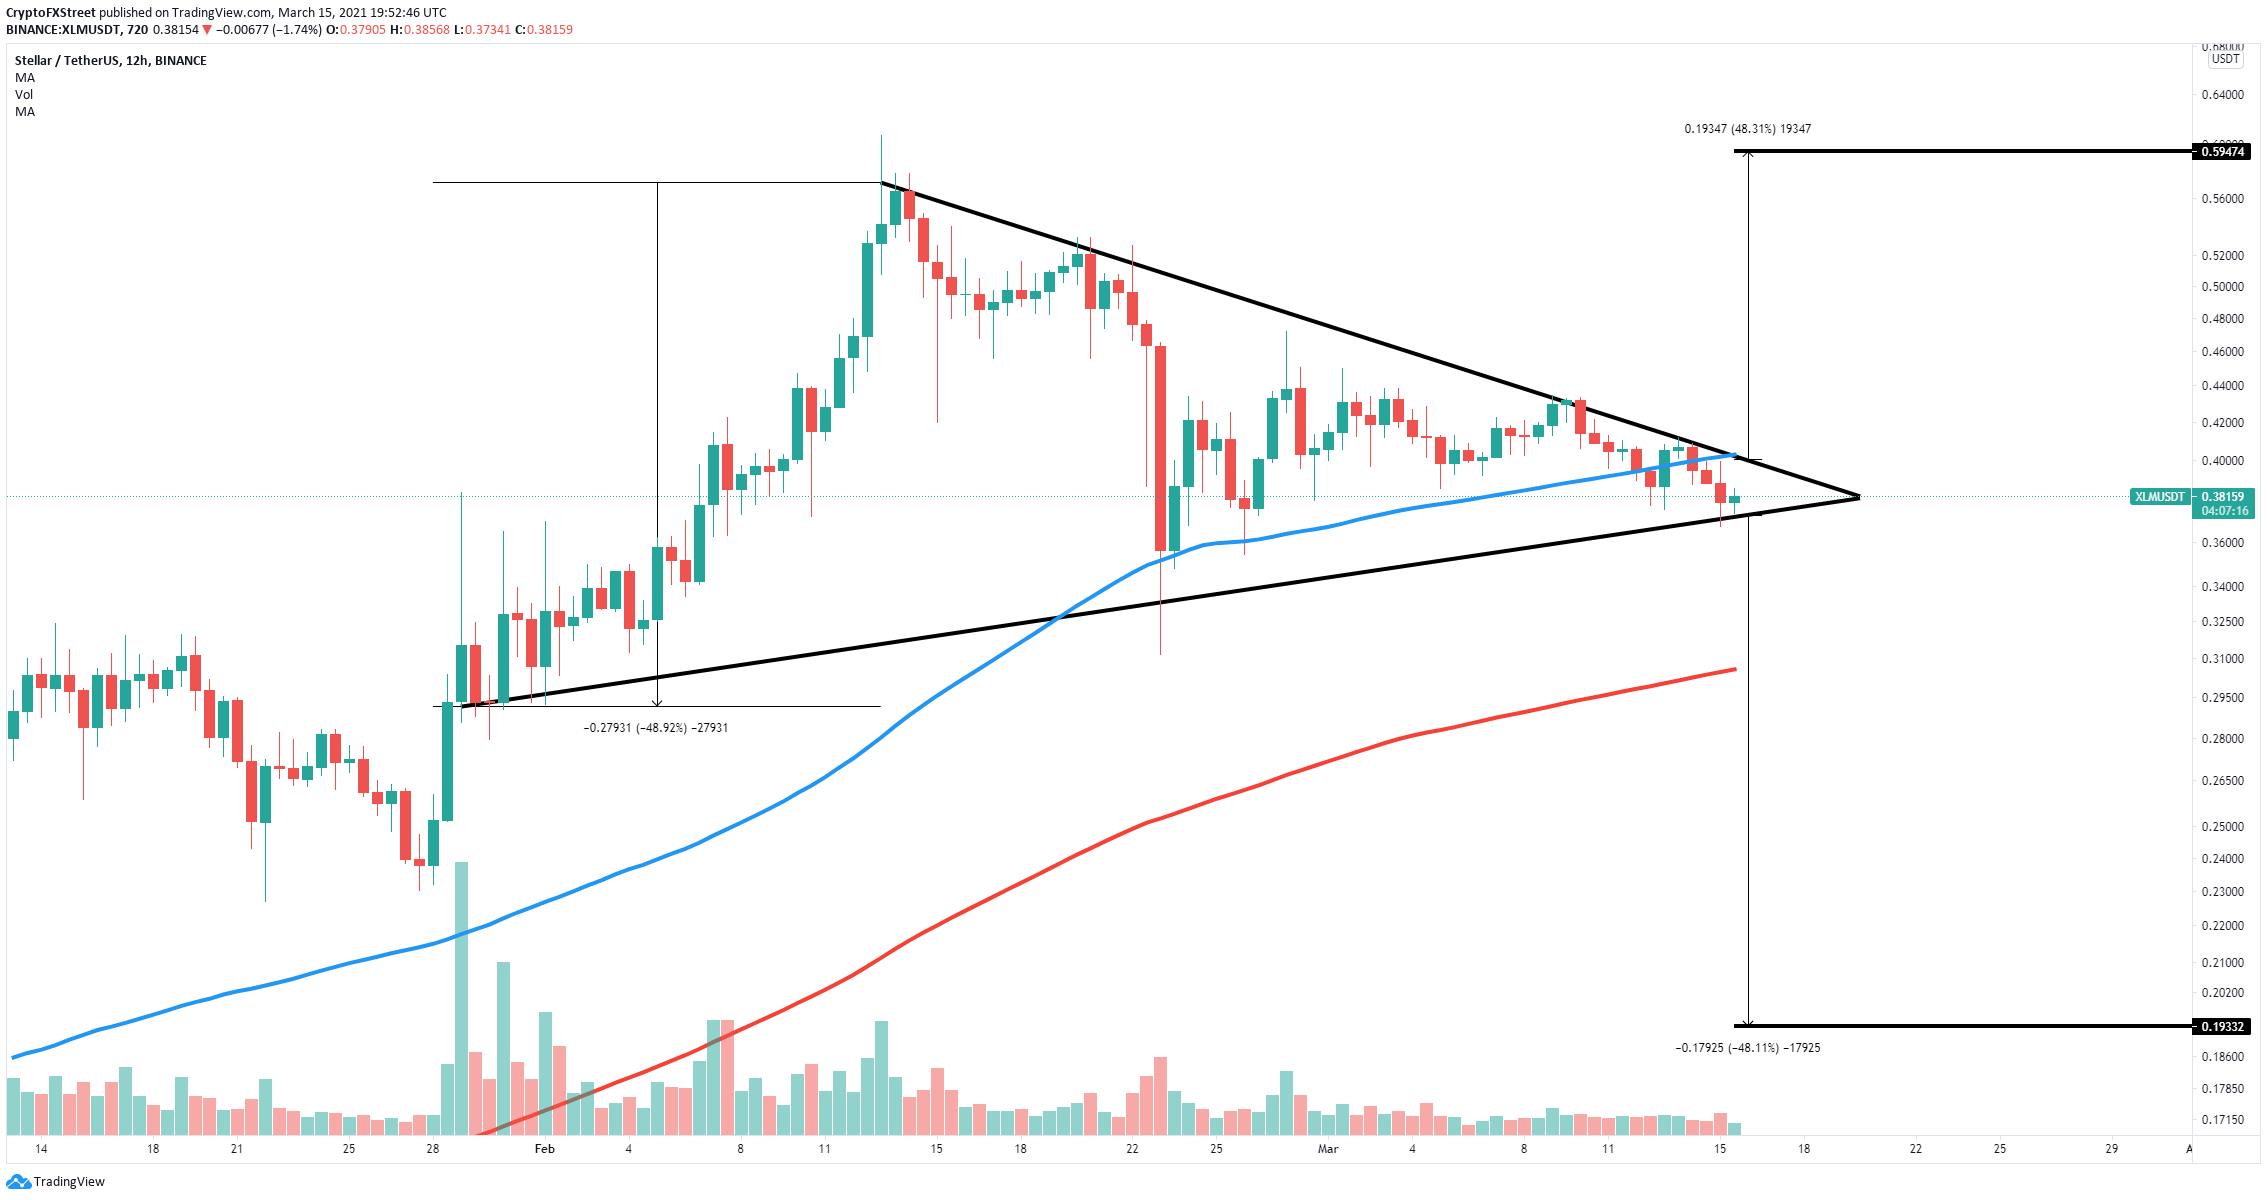
XLM/USD 12-hour chart
A breakout above the key resistance of $0.402 should drive Stellar price towards a high of $0.60 in the long-term, potentially pausing at $0.446 and $0.524.
On the other way, a breakdown below the key support level of $0.37 will drive Stellar price down to $0.306 at the 200-SMA and as low as $0.193 if this level breaks.
Author

Lorenzo Stroe
Independent Analyst
Lorenzo is an experienced Technical Analyst and Content Writer who has been working in the cryptocurrency industry since 2012. He also has a passion for trading.


