XLM Price Prediction: Stellar screams sell as technicals flip massively bearish
- Stellar gradually explores downstream price levels while a descending trendline caps the upside.
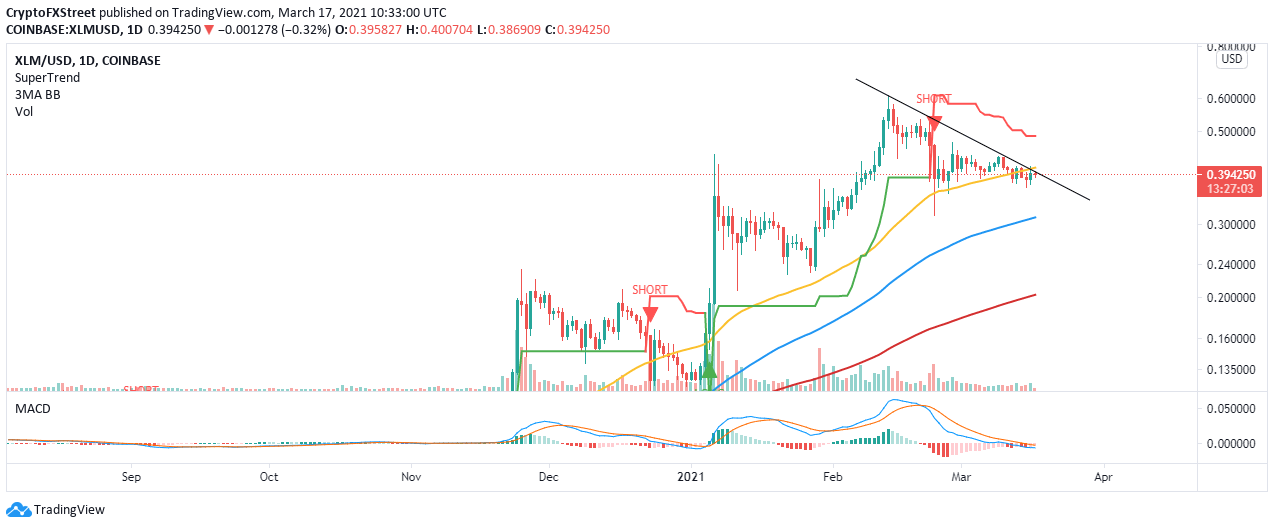
- The SuperTrend indicator recently gave a signal to short XLM on the daily chart.
- The MACD bearish impulse has reinforced the bearish outlook.
- Gains above the 50-day SMA are likely to sabotage the impending downswing to $0.3.

Stellar has lost a significant amount of its value from the yearly high traded at $0.6. The correction from this level was accentuated by the bearish wave that swept across the market on Monday. Recently, support was established at $0.36, but recovery has been limited under a descending trendline.
Stellar eyes another dip before recovery
Over the last 24 hours, Stellar has lost only 0.9% of its value and is 5% down in a period of seven days. At the time of writing, the cross-border token is teetering at $0.39, while bulls battle critical resistance at the ascending trendline.
If the immediate resistance stays put, we can anticipate declines to continue in the near term. Meanwhile, the Moving Average Convergence Divergence (MACD) points that the least resistance path is to the south. Note that the MACD line (blue) is below the signal line, thus cementing the bears’ presence in the market.
XLM/USD 4-hour chart
The SuperTrend indicator has latterly turned bearish, suggesting to investors to short Stellar. This indicator sends long-term signals for traders to either short or long an asset. With the signal currently in red and above the price, declines are most likely to continue toward the 100 Simple Moving Average, at $0.3.
Looking at the other side of the picture
Two key levels cap stellar’s upside; the descending trendline and the 50 SMA. If a sideways price action comes into the picture, stability will return, allowing bulls to focus on higher levels. Trading above these hurdles would serve as a huge bullish signal for an upswing back to $0.6
Author

John Isige
FXStreet
John Isige is a seasoned cryptocurrency journalist and markets analyst committed to delivering high-quality, actionable insights tailored to traders, investors, and crypto enthusiasts. He enjoys deep dives into emerging Web3 tren


