XLM price advances further as Stellar bulls get back to the market
- XLM price is being supported by an upward trend line from June 22.
- The correction now is no worry as the intermediate $0.267 level is holding as short-term support.
- After a few consecutive days of straight gains, we see some profit-taking in markets in general.

XLM price bounced off intermediate support and seems technically set up to go to $0.30.
XLM price in triangle play on the 6-hour chart
XLM price had a rough week last week with the dip toward $0.20. The level held, and slowly but surely, Stellar has traded higher from this level. It goes to show the importance of big figures and psychological levels again.
This week a triangle got formed with multiple tests of the blue ascending trend line on the 27 and 28 of June. XLM price was that much in favor that it could even break the orange descending trend line. After the clear break, it saw a retest and a bounce back up toward $0.26.
Buyers have been very much aware of these technical levels and have proven their appetite in Stellar with a large green candle each time. XLM price showed this when it hit $0.20, when it hit $0.24, with the blue trend line on June 28 and when it bounced off the intermediate support at $0.267.
Overall, sentiment in the markets was very much risk-on with the Nasdaq and the S&P500 hitting new all-time highs, and that helped XLM price as well to almost hit $0.30. But Stellar faded a little since the Asian open this morning as markets are under a bit of profit-taking.
We will need to wait until the opening bell to see the overall sentiment and if markets can get beyond this profit-taking phase to march higher. If that is the case, XLM price can complete this triangle formation and hit $0.3 by the end of this week.
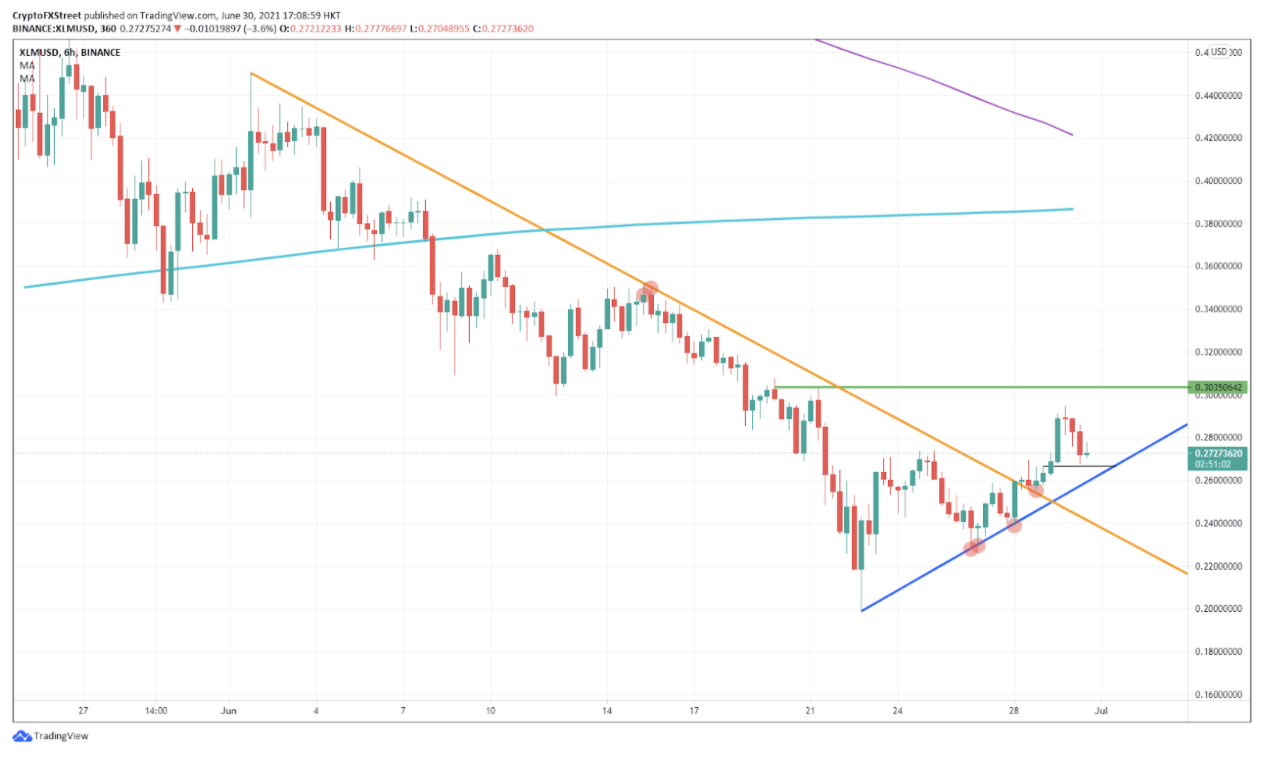
XLM/USD 6-hour chart
Even if XML price breaks the short-term support at $0.267, we still have the supporting blue trend line just below near $0.26. But if that level gives way as well, expect a retest of the orange descending trend line near $0.24. This could be the case when markets are switching toward risk-off and stocks are in apparent decline.
If markets would go in complete sell-off mode for a few days, expect even a retest of the $0.20 level again by next week.
Author

Filip Lagaart
FXStreet
Filip Lagaart is a former sales/trader with over 15 years of financial markets expertise under its belt.



