Shiba Inu price to retest crucial support before SHIB bulls set up next advance
- Shiba Inu price surged above the descending triangle pattern that has sealed the meme token for over a month.
- The recent breakout above the strong resistance trend line paints a bullish picture for a SHIB price reversal.
- However, Shiba Inu has multiple obstacles ahead, which could hinder the asset’s rally.
Shiba Inu price has recently broken out of a bearish formation, introducing the potential for a new rally. SHIB escaped above a critical resistance trend line that has acted as a possible turning point for the meme coin’s disappointing returns since the May crypto market crash.
Shiba Inu price uptrend limited by obstacles
Shiba Inu price has surged over 60% since its local bottom recorded on June 22. SHIB has been locked in a descending triangle formation since May 19 on the 12-hour chart, as SHIB bulls were unable to lift prices higher against the overpowering distribution of the sellers.
SHIB overcoming the descending trend line of the triangle pattern gives Shiba Inu price a measured target of 50% at $0.00001270, the highest point of the chart pattern.
The prevailing direction for Shiba Inu is bullish. However, the meme-based token could face several obstacles before continuing its rally. SHIB could see a retest of the descending trend line that acted as strong resistance for the coin prior to heading higher.
Shiba Inu price struggled to reach the 100 twelve-hour Simple Moving Average (SMA), which is acting as strong resistance for SHIB. The meme token further slumped below the 50% Fibonacci extension level at $0.00000906 as a result.
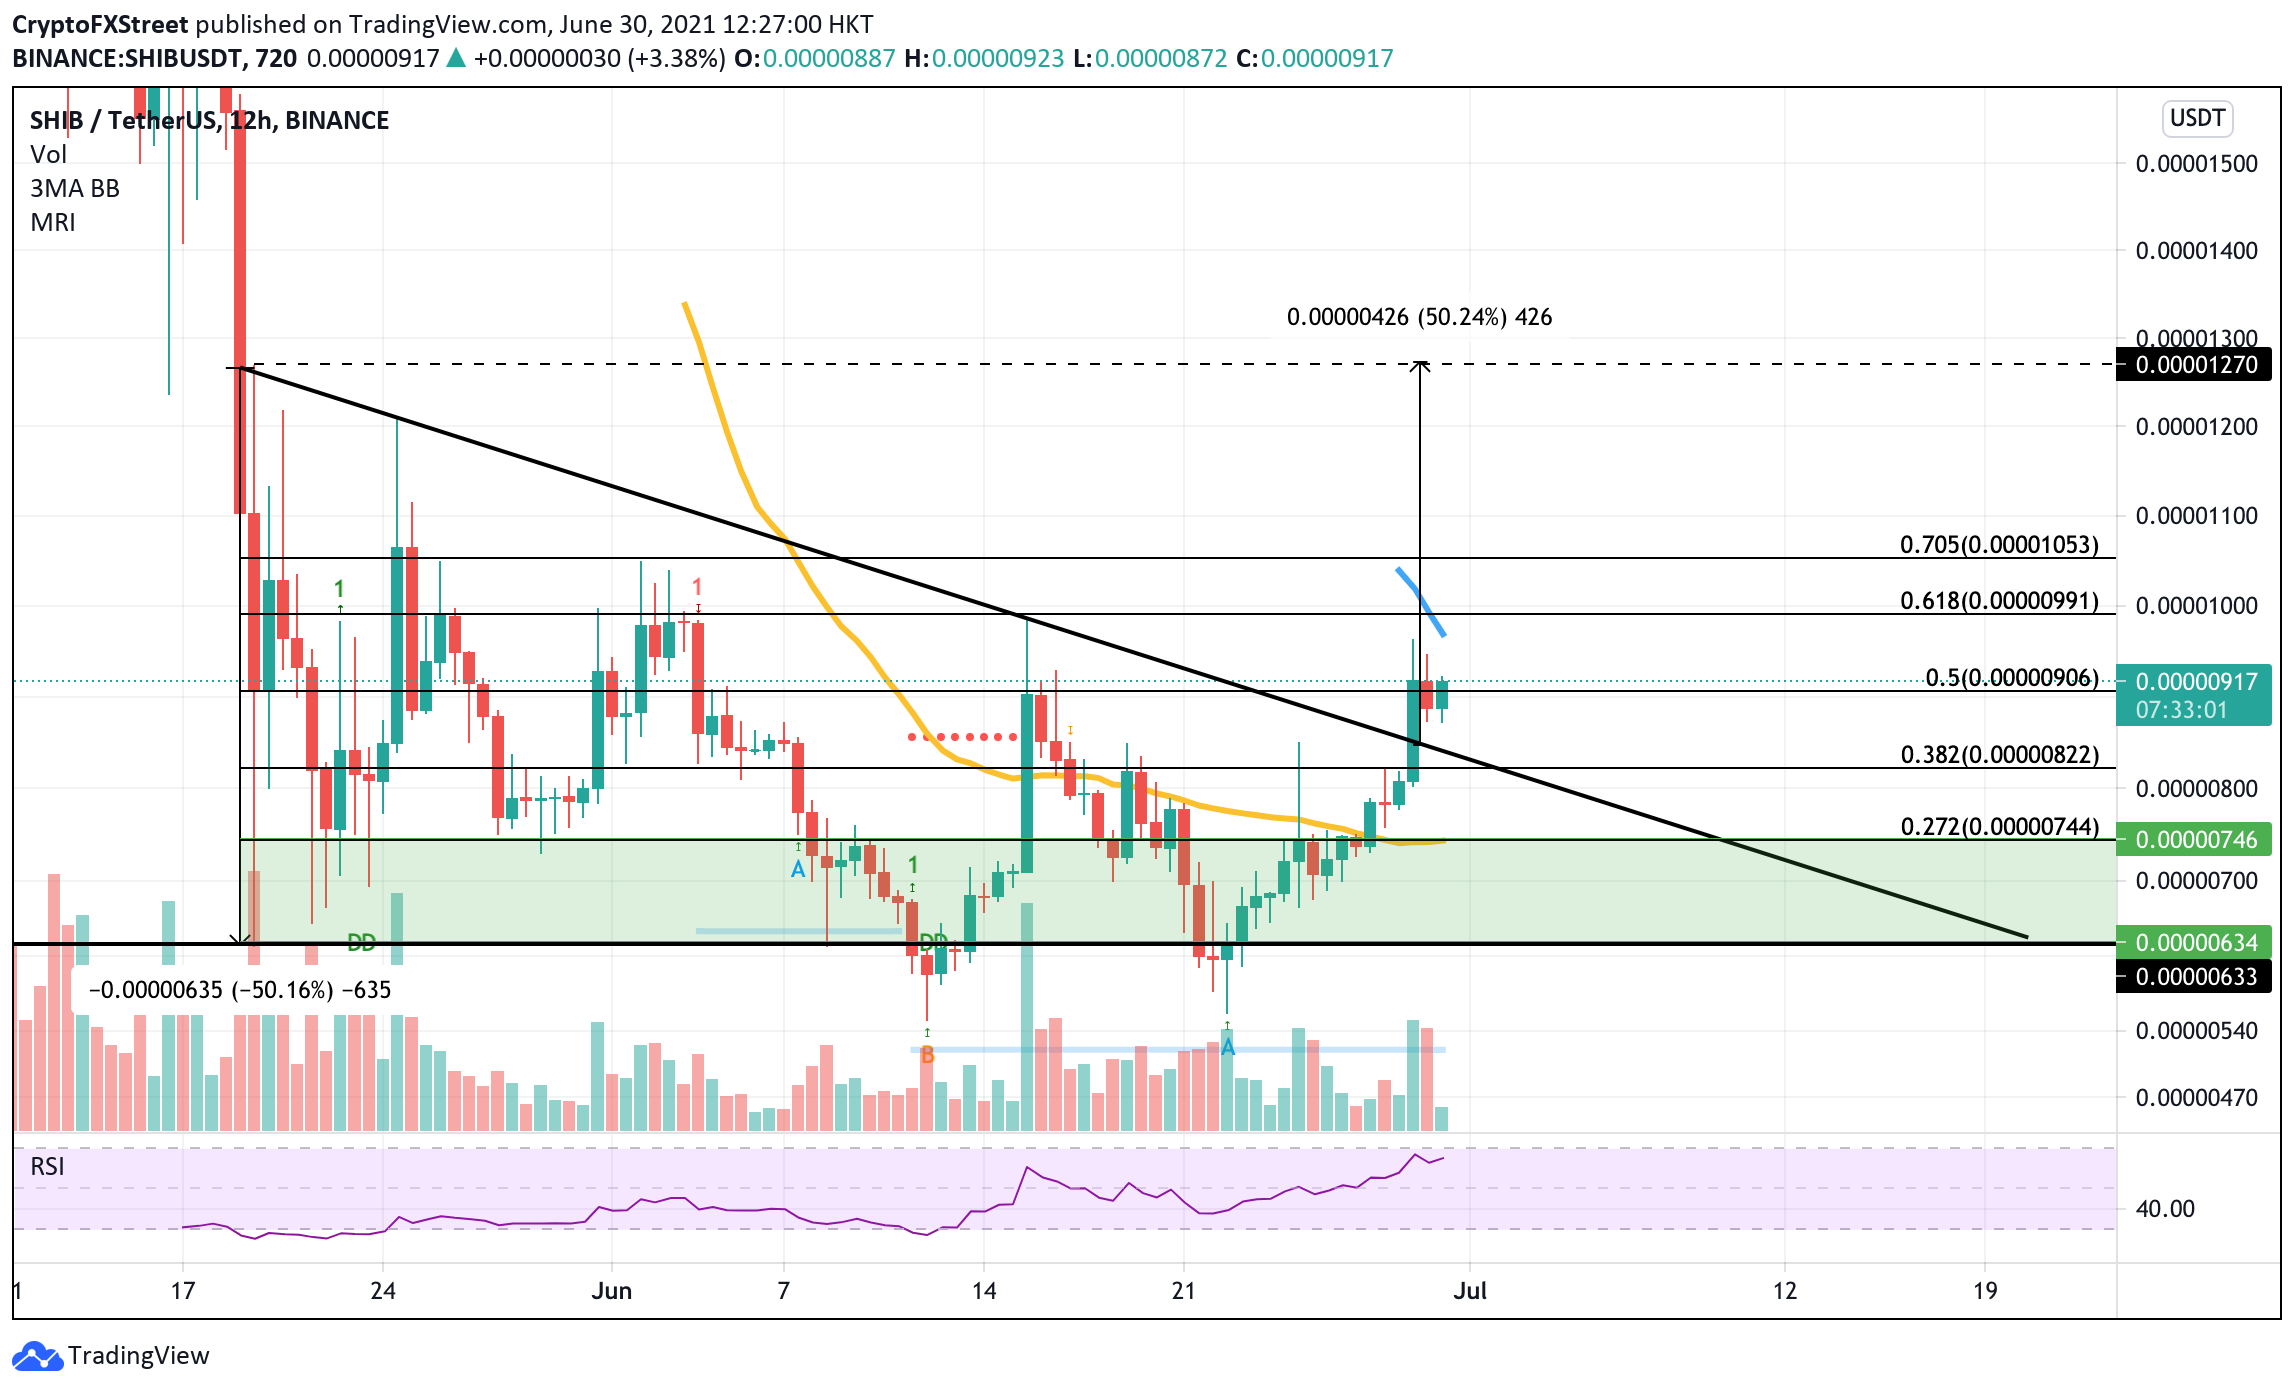
SHIB/USDT 12-hour chart
Only a candle close above $0.00000906 would open up the possibility of the canine-themed token to attempt reaching the 100 twelve-hour SMA at $0.00000970 before meeting the next resistance level at the 61.8% Fibonacci extension level at $0.00000991.
Should Shiba Inu price action work in favor of the bulls, SHIB would also need to overcome the 70.5% Fibonacci extension level at $0.00001053 before the bullish thesis of a 50% breakout can be expected.
An unanticipated increase in selling pressure could drive down Shiba Inu price. Still, SHIB would likely find support at the hypotenuse of the descending triangle at $0.00000838 and at the 38.2 Fibonacci retracement level at $0.00000822.
Failing to hold above the aforementioned critical lines of defense could spell further trouble for the bulls. However, outstanding support is found at the 50 twelve-hour SMA, coinciding with the 27.2% Fibonacci retracement level and the start of the demand zone at $0.00000744.
Author

Sarah Tran
Independent Analyst
Sarah has closely followed the growth of blockchain technology and its adoption since 2016.


