Top Five cryptocurrencies to watch this week: BTC, ADA, THETA, XMR, AMP

The U.S. Federal Reserve’s plans to advance its timeline for rate hikes to 2023 has led to profit-booking in the U.S. stock market, gold, and Bitcoin (BTC). The markets received a second jolt on June 18 after James Bullard, the president of the United States Federal Reserve Bank of St. Louis, warned th the first rate hike could come as soon as 2022.
Now crypto analysts are divided on the next move from Bitcoin. Josh Rager believes Bitcoin may have hit its cycle top at $64,500 and Robert Kiyosaki, author of "Rich Dad Poor Dad," believes Bitcoin can plummet to $24,000.
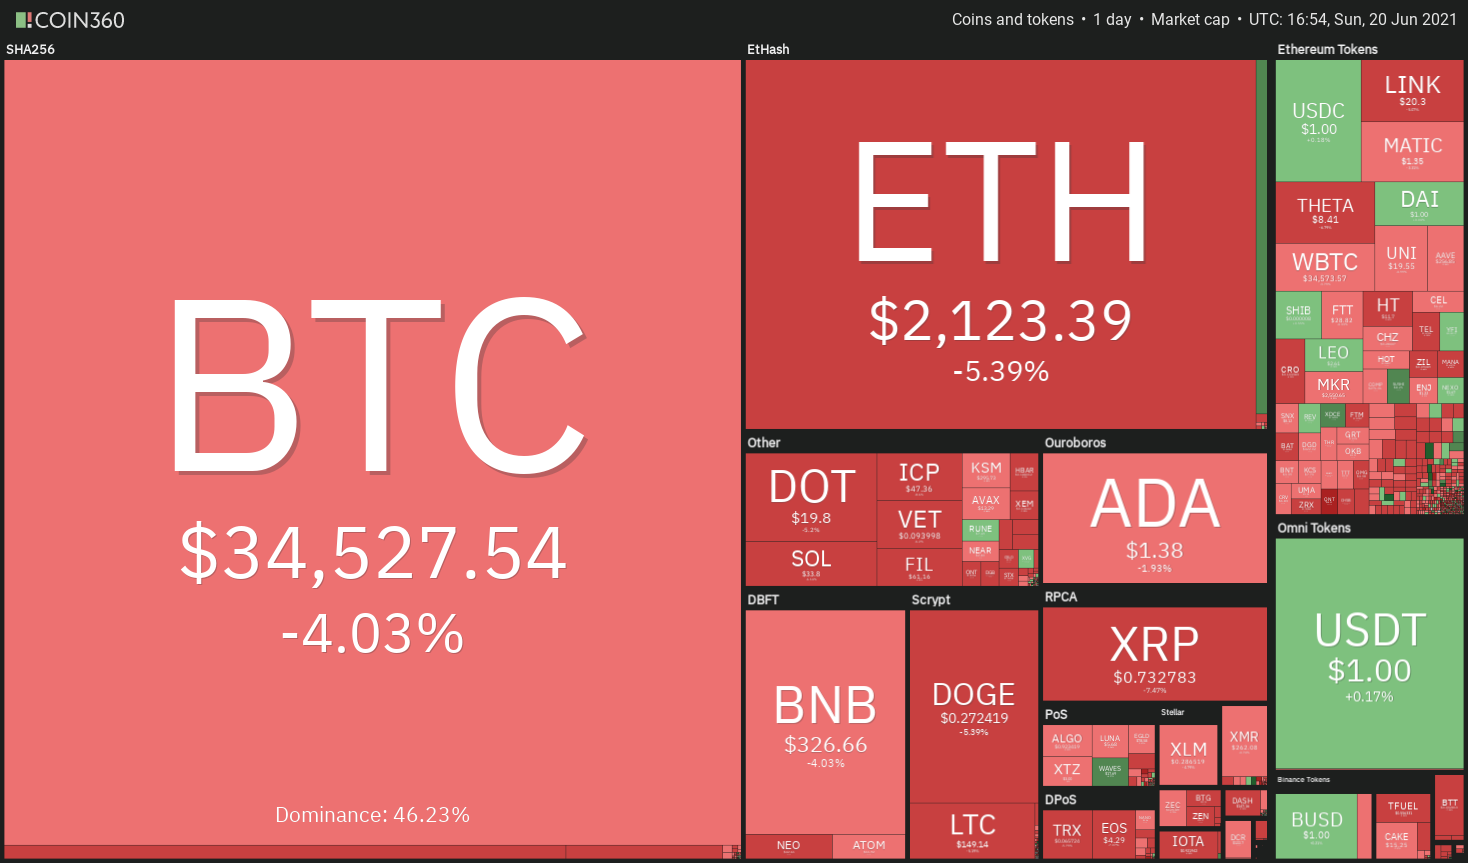
Crypto market data daily view. Source: Coin360
However, PlanB, the creator of the stock-to-flow Bitcoin price forecasting model, has retained his bullish view on Bitcoin. His best-case scenario for Bitcoin is a massive rally to $450,000 while his “worst-case scenario” also paints a bullish target at $135,000 by the end of 2021.
Citing recent on-chain data, other analysts have pointed out that long-term holders have been buying Bitcoin in the past few days.
Can buying by the long-term investors offset selling from the speculators? What do the technicals project, a short-term recovery or a further fall? Let’s study the charts of the top-5 cryptocurrencies to find out.
BTC/USDT
Bitcoin has been range-bound between $31,000 and $42,451.67 for the past few days. The price turned down from $41,330 on June 15 and the bears pulled the price below the 20-day exponential moving average ($37,439) on June 18.
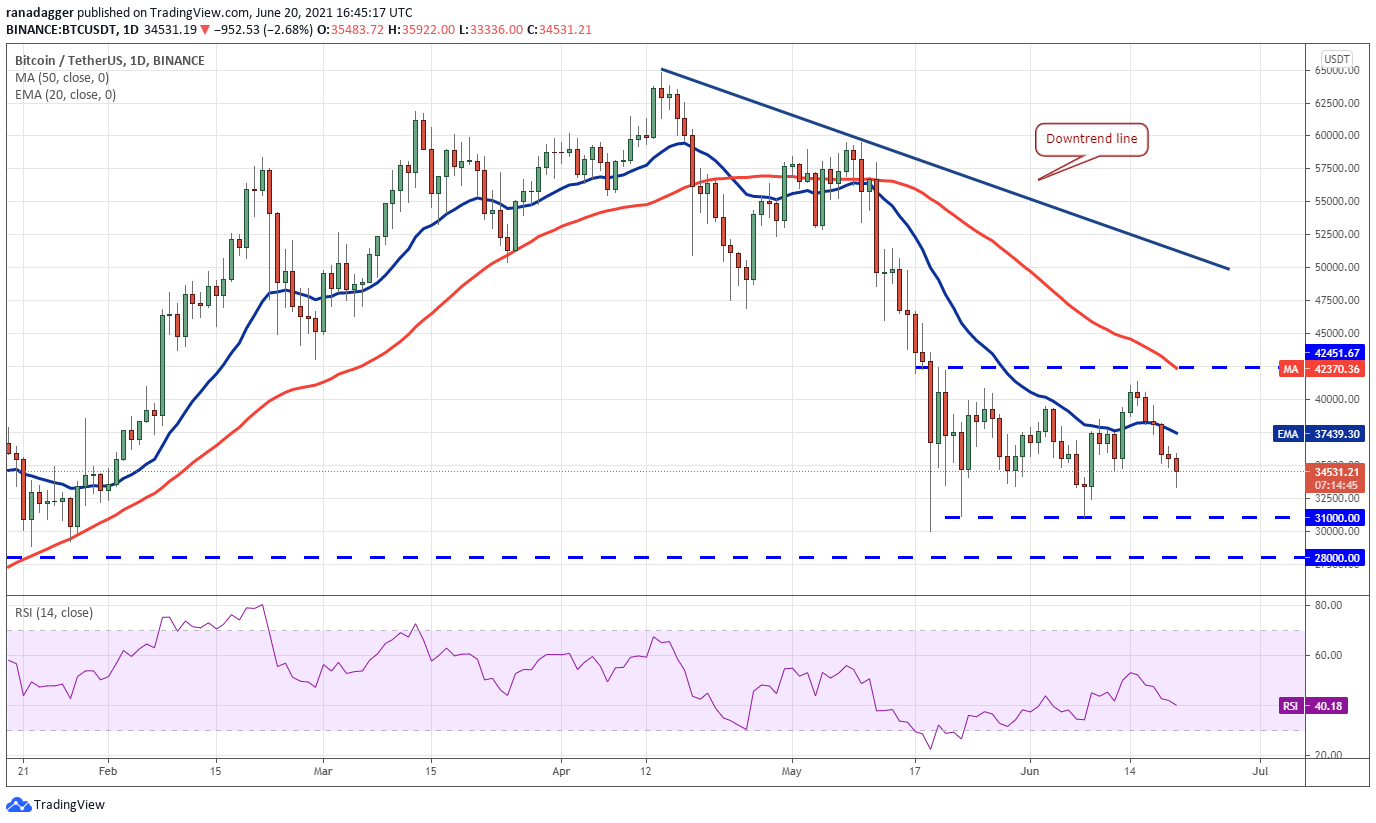
BTC/USDT daily chart. Source: TradingView
The sellers will now try to sink the price to the support of the range at $31,000. The 20-day EMA has started to turn down and the relative strength index (RSI) below 41 suggests that bears have the upper hand.
However, the BTC/USDT pair rebounded off $31,000 on two previous occasions on May 23 and June 8, hence the bulls will again try to defend this level. If they succeed, the pair could extend its stay inside the range for a few more days.
Conversely, if bears sink the price below $31,000, the pair could drop to $28,000 and then to $20,000. Such a move will be a huge negative and it could delay the start of the next leg of the uptrend.

BTC/USDT 4-hour chart. Source: TradingView
The bears have pulled the price below the $34,600 support on the 4-hour chart. If they manage to sustain the price below this level, the pair is likely to drop to the $31,000 support. The downsloping 20-EMA and the RSI near the oversold zone indicate advantage to the bears.
On the other hand, if the price turns up from the current level and rises above $36,457, it will suggest that traders accumulated at lower levels. The pair may then rise to the 50-simple moving average and later to the $41,330 to $42,451.67 resistance zone. A breakout of this zone will suggest that the correction is over.
ADA/USDT
Cardano (ADA) has been trading between $1.33 and $1.94 for the past few days. The rebound off the support on June 12 fizzled out at the 20-day EMA ($1.52) on June 15, indicating the sentiment has turned negative and traders are selling on rallies.
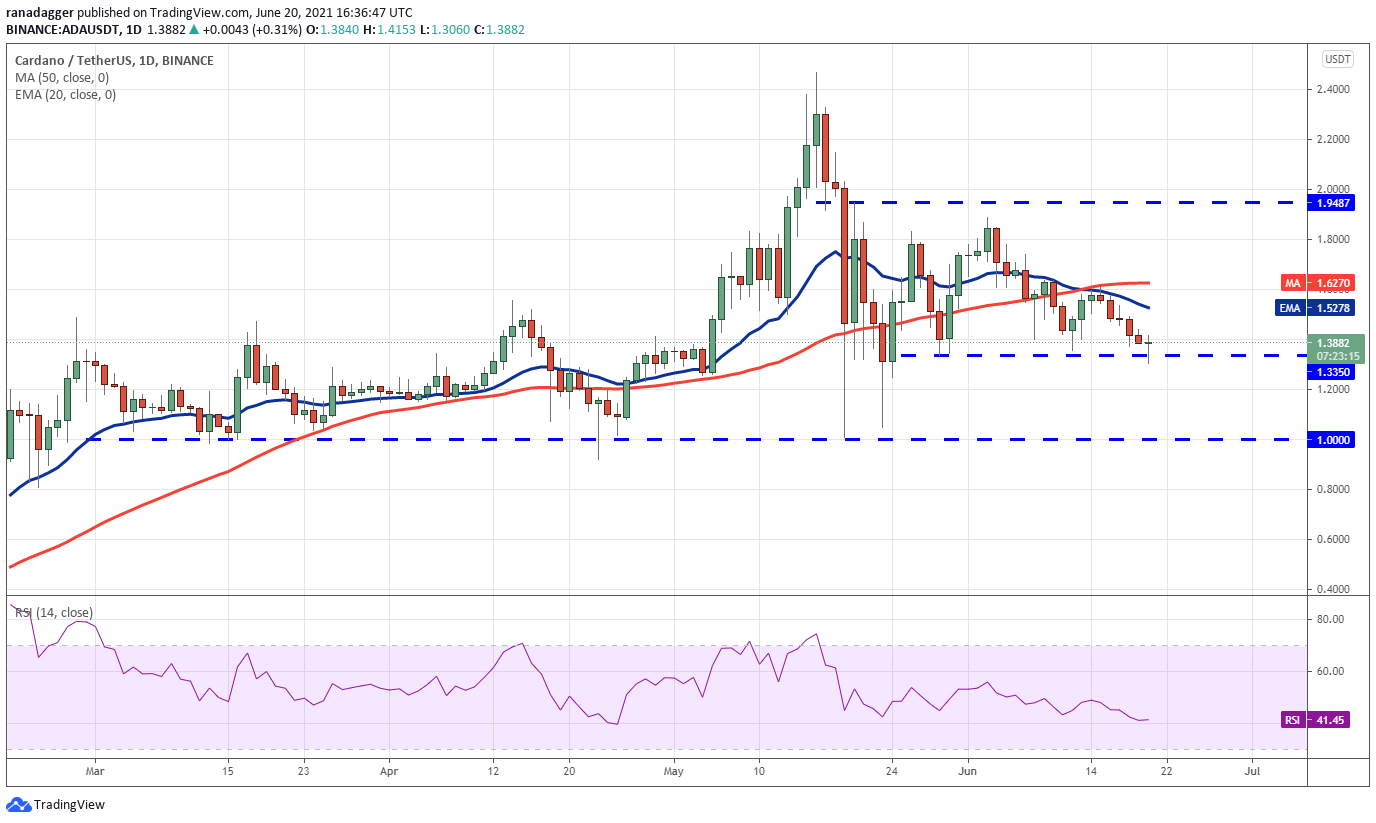
ADA/USDT daily chart. Source: TradingView
The bears will now try to sink the price below the $1.33 to $1.24 support zone. If they manage to do that, the ADA/USDT pair could slump to the critical support at $1. The downsloping 20-day EMA and the RSI below 42 suggest that bears are in control.
On the contrary, if the bulls again defend the support zone, it will suggest demand at lower levels. That could keep the pair range-bound for a few more days. A breakout and close above $1.94 will indicate that bulls are back in command.
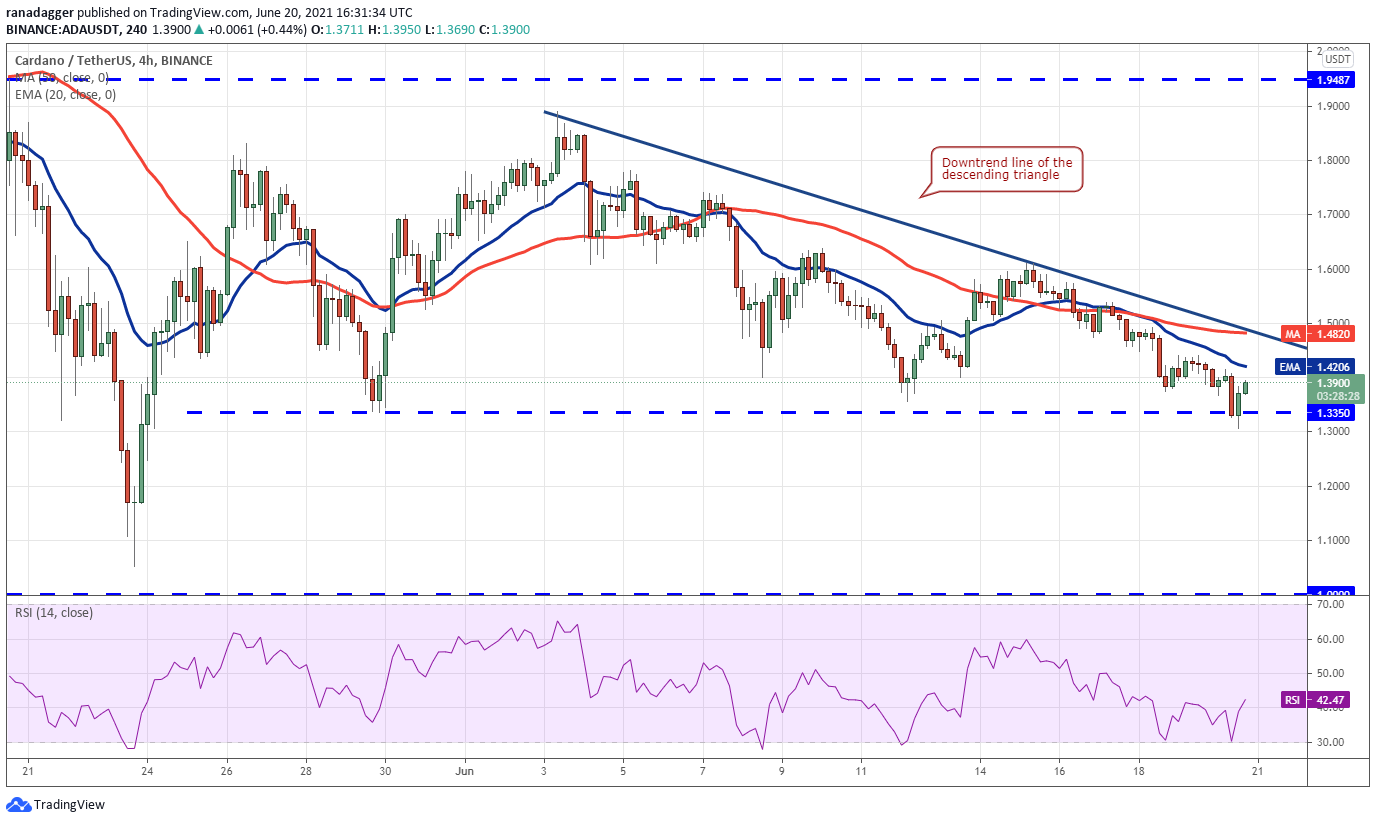
ADA/USDT 4-hour chart. Source: TradingView
The 4-hour chart shows the bears pulled the price below the $1.33 support today but the failure to sustain the lower levels suggests accumulation on dips. The buyers will now try to propel the price above the downtrend line.
If they succeed, it will invalidate the bearish pattern. Such a move could catch the aggressive bears off guard and result in a short squeeze that may propel the price to $1.74 and then $1.88.
Alternatively, if the price turns down and sustains below $1.33, the pair will complete the descending triangle pattern. This bearish setup has a target objective at $0.78.
THETA/USDT
The bulls pushed THETA above the resistance line of the descending channel on June 17 but they could not cross the hurdle at $10.47. This shows that bears have not thrown in the towel yet and are attempting to fake the breakouts.

THETA/USDT daily chart. Source: TradingView
The price has dipped below the 20-day EMA ($8.65) today, suggesting that the short-term trend has turned in favor of the bears. However, the bulls are unlikely to give up easily. They will try to stall the decline at $7.33.
If the price rebounds off this support and rises above the moving averages, it will indicate strong demand at lower levels. The buyers will then make one more attempt to clear the hurdle at $10.47.
If they succeed, the THETA/USDT pair could start a rally to $13.20. This positive view will invalidate if the bears sink the price below $7.37. Such a move could result in a decline to $6 and then to $4.57.
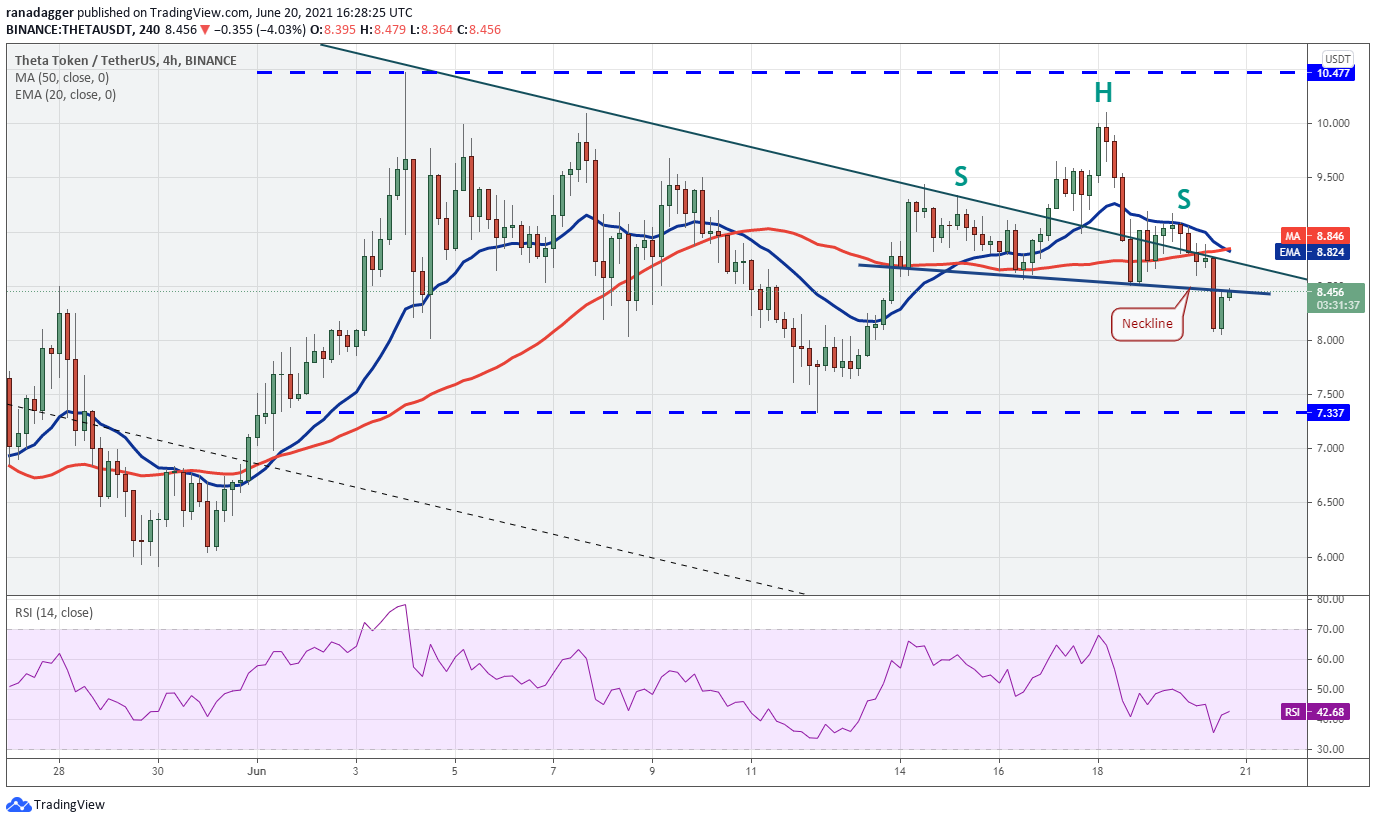
THETA/USDT 4-hour chart. Source: TradingView
The 4-hour chart shows the formation of a head and shoulders pattern. This setup has a target objective at $7.02.
However, the bulls are trying to push the price back above the neckline. If they do that, the short-term bears who may have initiated short positions on the break of the neckline may get trapped.
This could result in short covering and the pair may rally to $9.19. A break above this resistance may open the doors for a rally to $10.10 and then $10.47.
XMR/USDT
Monero (XMR) turned down from the downtrend line on June 19 and the bears will now try to sink the price to the support at $225. This is an important support to watch out for because the bulls have repeatedly defended this level in the past few days.
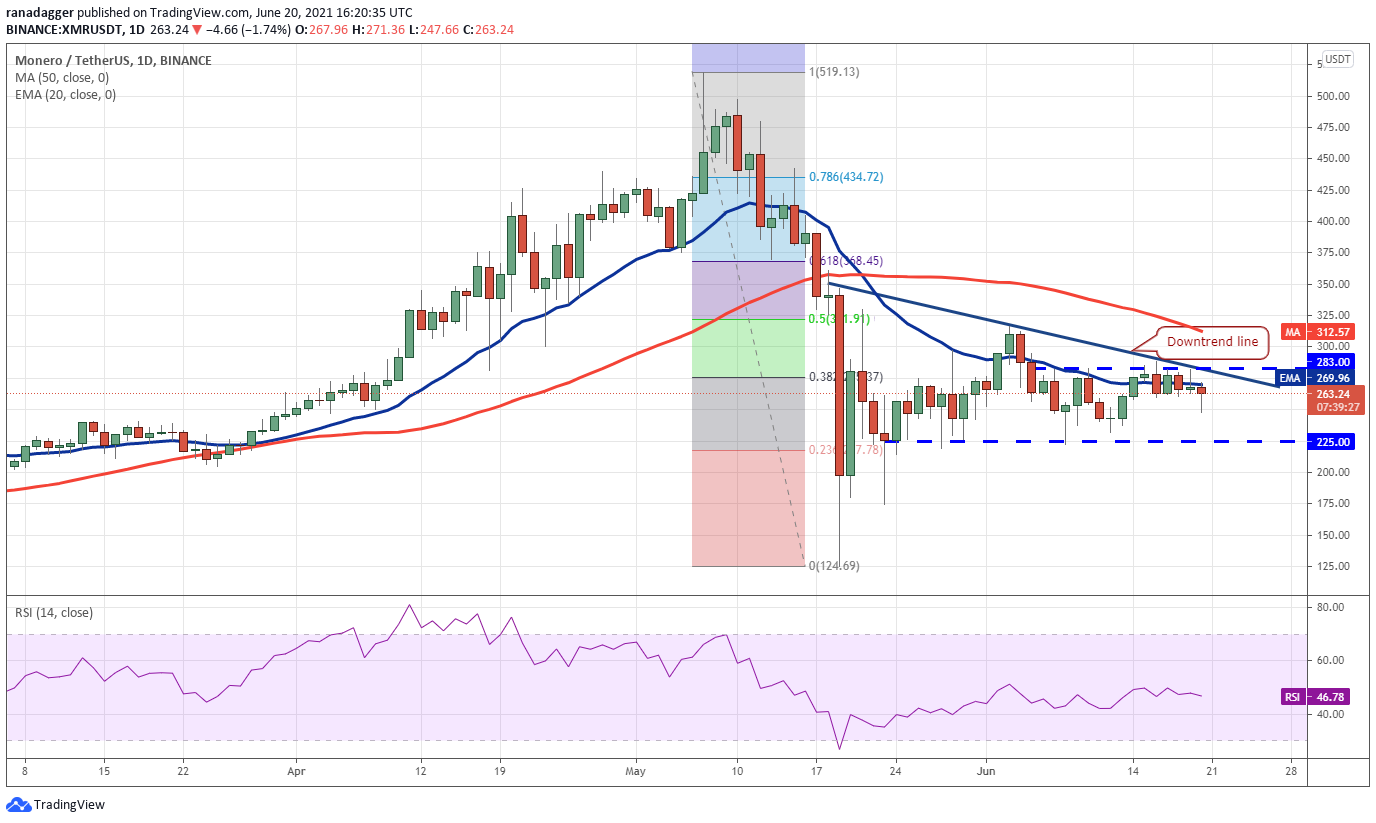
XMR/USDT daily chart. Source: TradingView
If the price rebounds off $225, buyers will make one more attempt to drive the price above the downtrend line. If they do that, the XMR/USDT pair may challenge the 50-day SMA ($312) and then rise to $347.
Contrary to this assumption, if bears sink the price below the $225 support, the pair will complete a descending triangle pattern. This bearish setup could attract further selling, resulting in a drop to $175 and then $124.69.
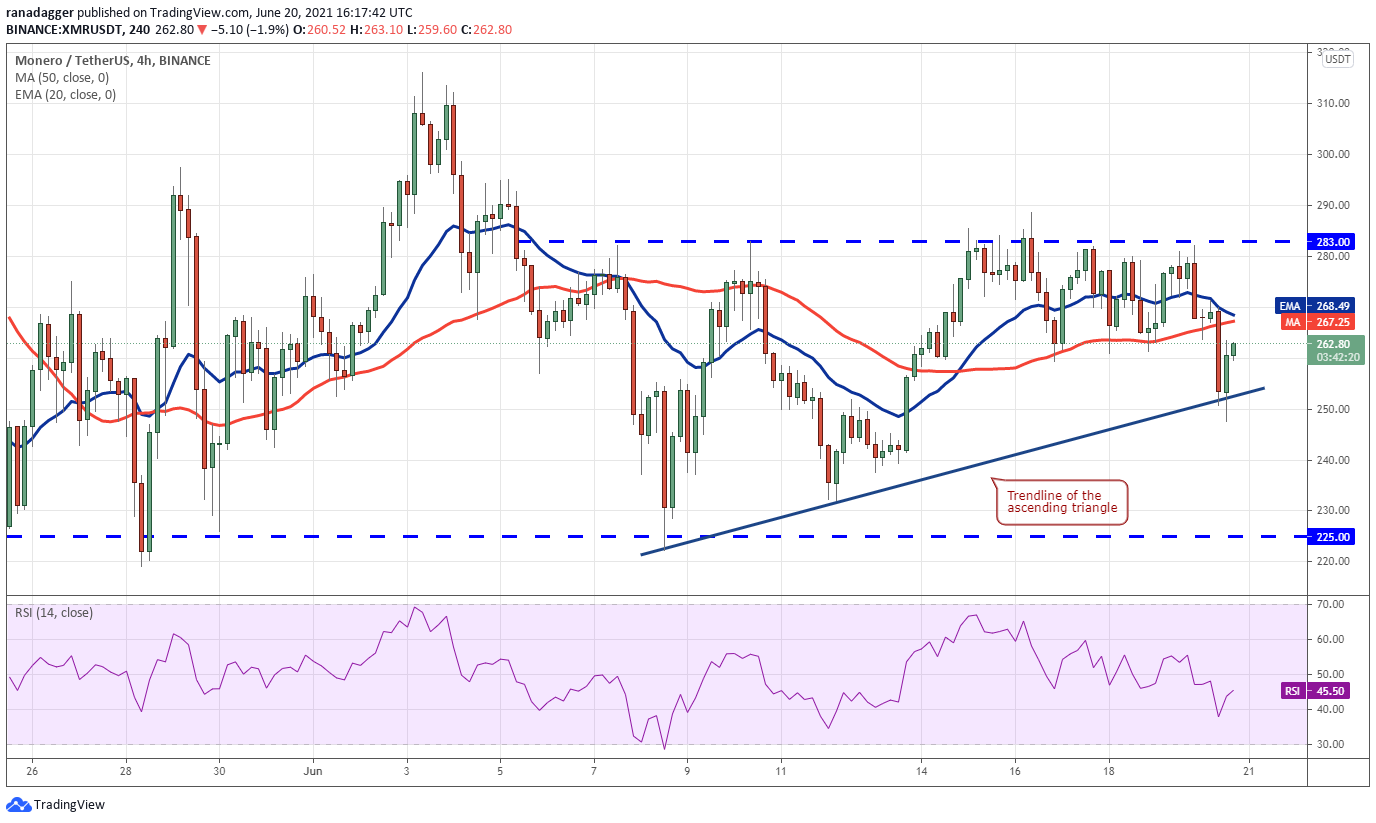
XMR/USDT 4-hour chart. Source: TradingView
The 4-hour chart shows that bulls made several attempts to push and sustain the price above the $283 resistance but failed. This shows that the bears are defending this level aggressively.
The sellers pulled the price below the trendline of the ascending triangle today, but they could not sustain the lower levels. This suggests strong buying on dips. The bulls will now try to push the price above the moving averages and challenge the $283 resistance.
If buyers can thrust the price above this level, the ascending triangle pattern will complete and the pair could rally to $316.23 and then to the pattern target at $341.
This positive view will invalidate if bears sink and sustain the price below the trendline. Such a move could open the doors for a drop to $225.
AMP/USDT
Amp broke above the stiff overhead resistance at $0.076 on June 14 and hit an all-time high at $0.12 on June 16. However, profit-booking on June 17 has started a correction that has dropped to the breakout level at $0.076.
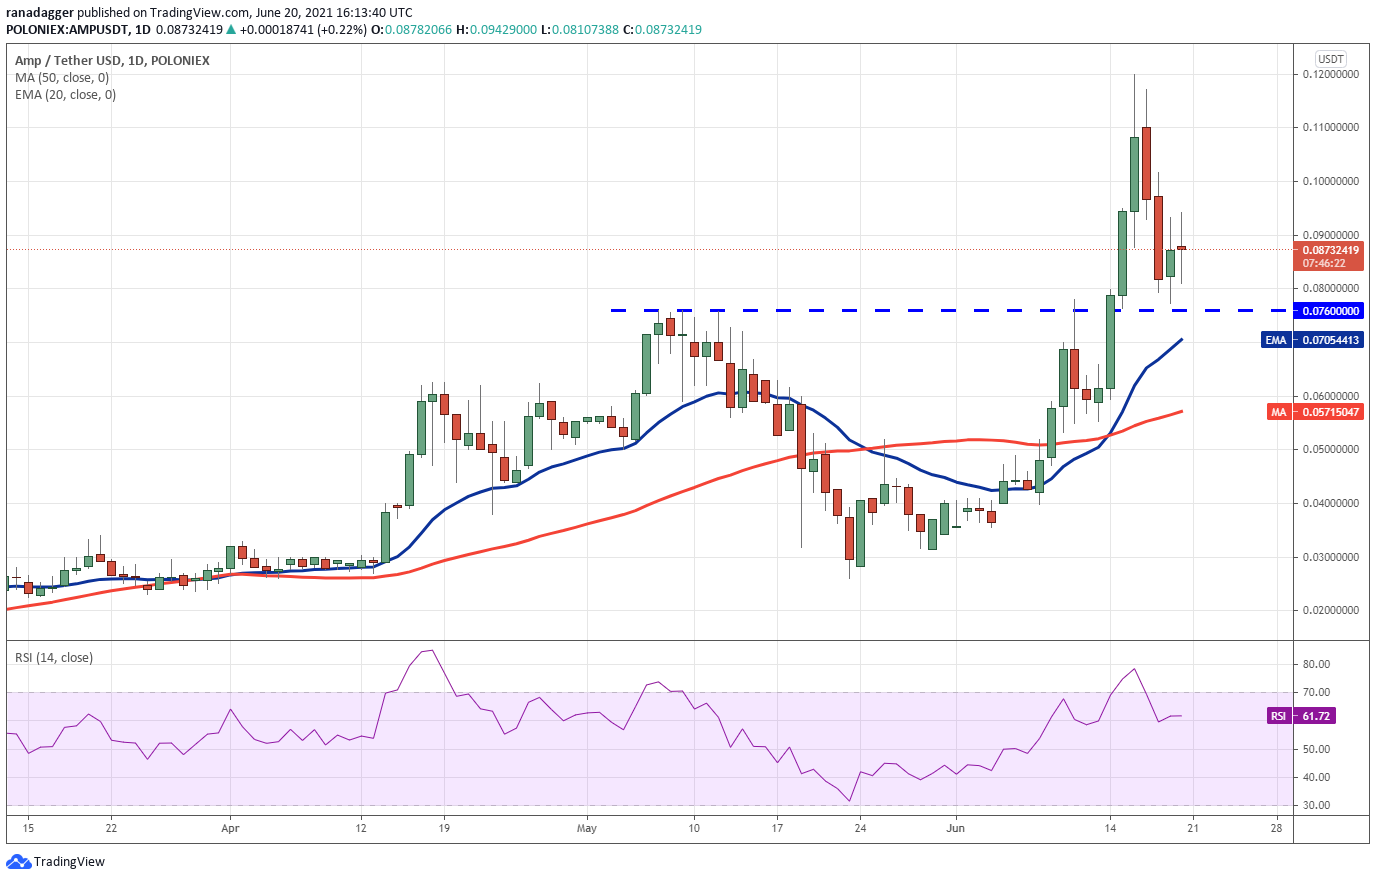
AMP/USDT daily chart. Source: TradingView
If bulls flip the $0.076 level to support, it will suggest that the sentiment remains positive and traders are accumulating on dips. The buyers will then try to push the price back toward the all-time high at $0.12.
A breakout and close above this resistance will suggest the resumption of the uptrend. The AMP/USDT pair could then rally to $0.185.
Contrary to this assumption, if the bears sink the price below $0.076, the pair could drop to the 20-day EMA ($0.07), which may again act as a strong support. However, if this support cracks, the pair could decline to the 50-day SMA ($0.05)
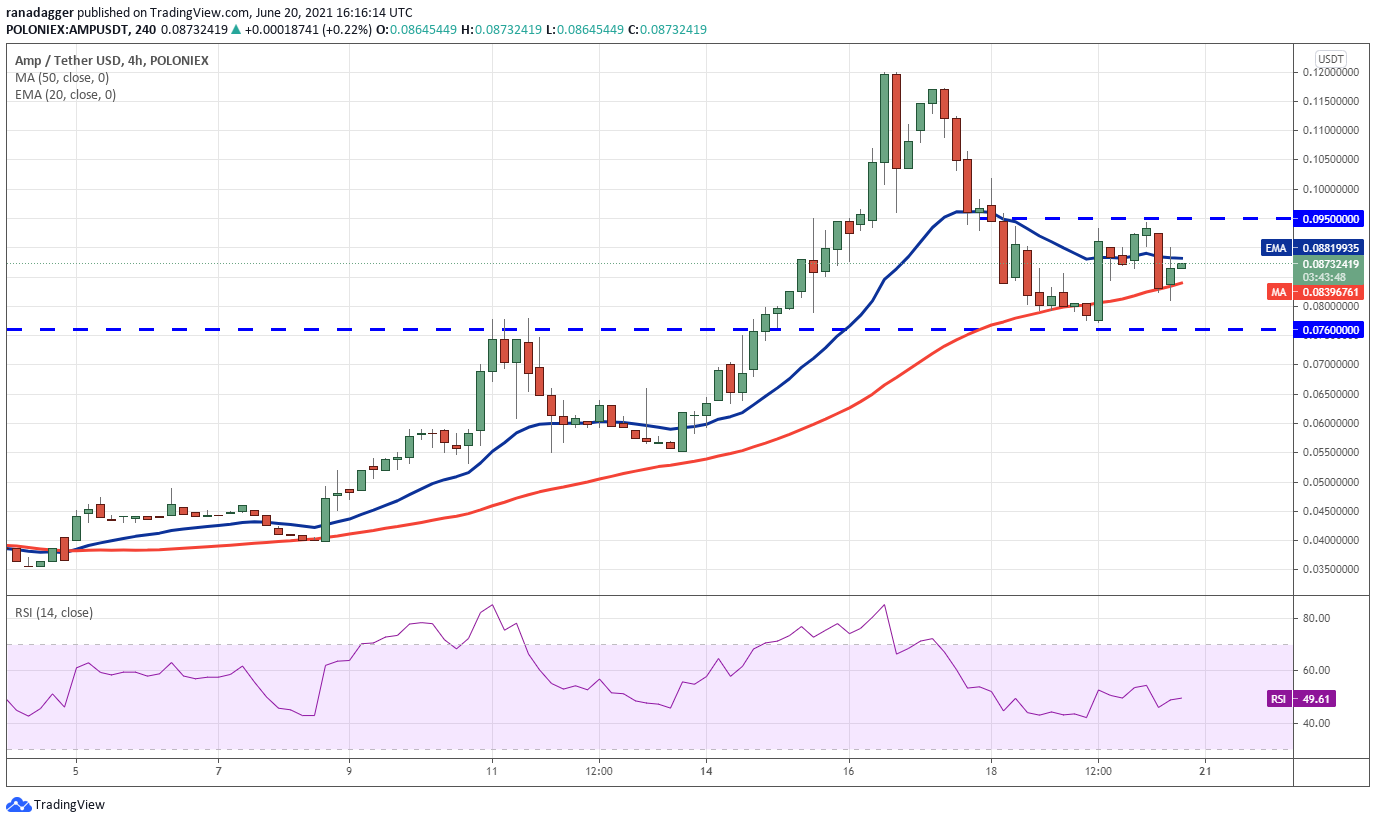
AMP/USDT 4-hour chart. Source: TradingView
The correction from the all-time high was arrested at the $0.076 support as the bulls defended the level aggressively. However, the buyers are struggling to push the price above the $0.095 resistance, indicating that bears are selling at higher levels.
The bulls are currently attempting to defend the 50-SMA and form a higher low in the short term. If they succeed, the pair may rise to $0.095. A breakout and close above this resistance could open the doors for a rally to the all-time high. This positive view will invalidate if the pair breaks and closes below $0.076.
Author

Cointelegraph Team
Cointelegraph
We are privileged enough to work with the best and brightest in Bitcoin.


