Why the $3,500 resistance level is the biggest challenge for Ethereum price
- Ethereum price stalls near the critical $3,500 price level.
- Consolidation between $3,300 and $3,500 may continue until early April.
- Very few warning signals for a broad sell-off exist, but downside risks remain a concern.

Ethereum price action looks poised to take a breather before continuing its spectacular run. After two consecutive days of late-session selling pressure, buyers appear apprehensive for the first time in over three weeks.
Ethereum price could see profit-taking before pushing on towards $4,000
Ethereum price is having some difficulty cracking the $3,500 resistance level. That difficulty is not much of a surprise when you consider the collection of resistance at $3,500: the weekly Kijun-Sen and 100% Fibonacci expansion. Achieving a breakout above this level will likely create another massive bullish drive for ETH.
The daily Relative Strength Index remains in bull market conditions and is not yet at the first overbought level of 80. This suggests that the Ethereum price could continue to push higher to at least the $3,800 value area. But even if that occurs, buying pressure may not cease. The weekly Relative Strength Index is just coming out of the long congestion zone of trading between the oversold levels of 40 and 50 since the beginning of 2022.
Additionally, because many new traders continue to view, incorrectly, the RSI as overbought as 70, Ethereum bulls may be developing a bear trap near $3,500. The interpretation of 70 as an overbought level was changed in 2012 with Connie Brown's groundbreaking work, 'Technical Analysis for the Trading Professional' – required reading for the CMT certification.
Upside potential could extend as high as the 161.8% Fibonacci expansion at $4,550. Downside risks are likely limited to the bottom of the bull flag and top of the Ichimoku Cloud (Senkou Span A) at $3,175.
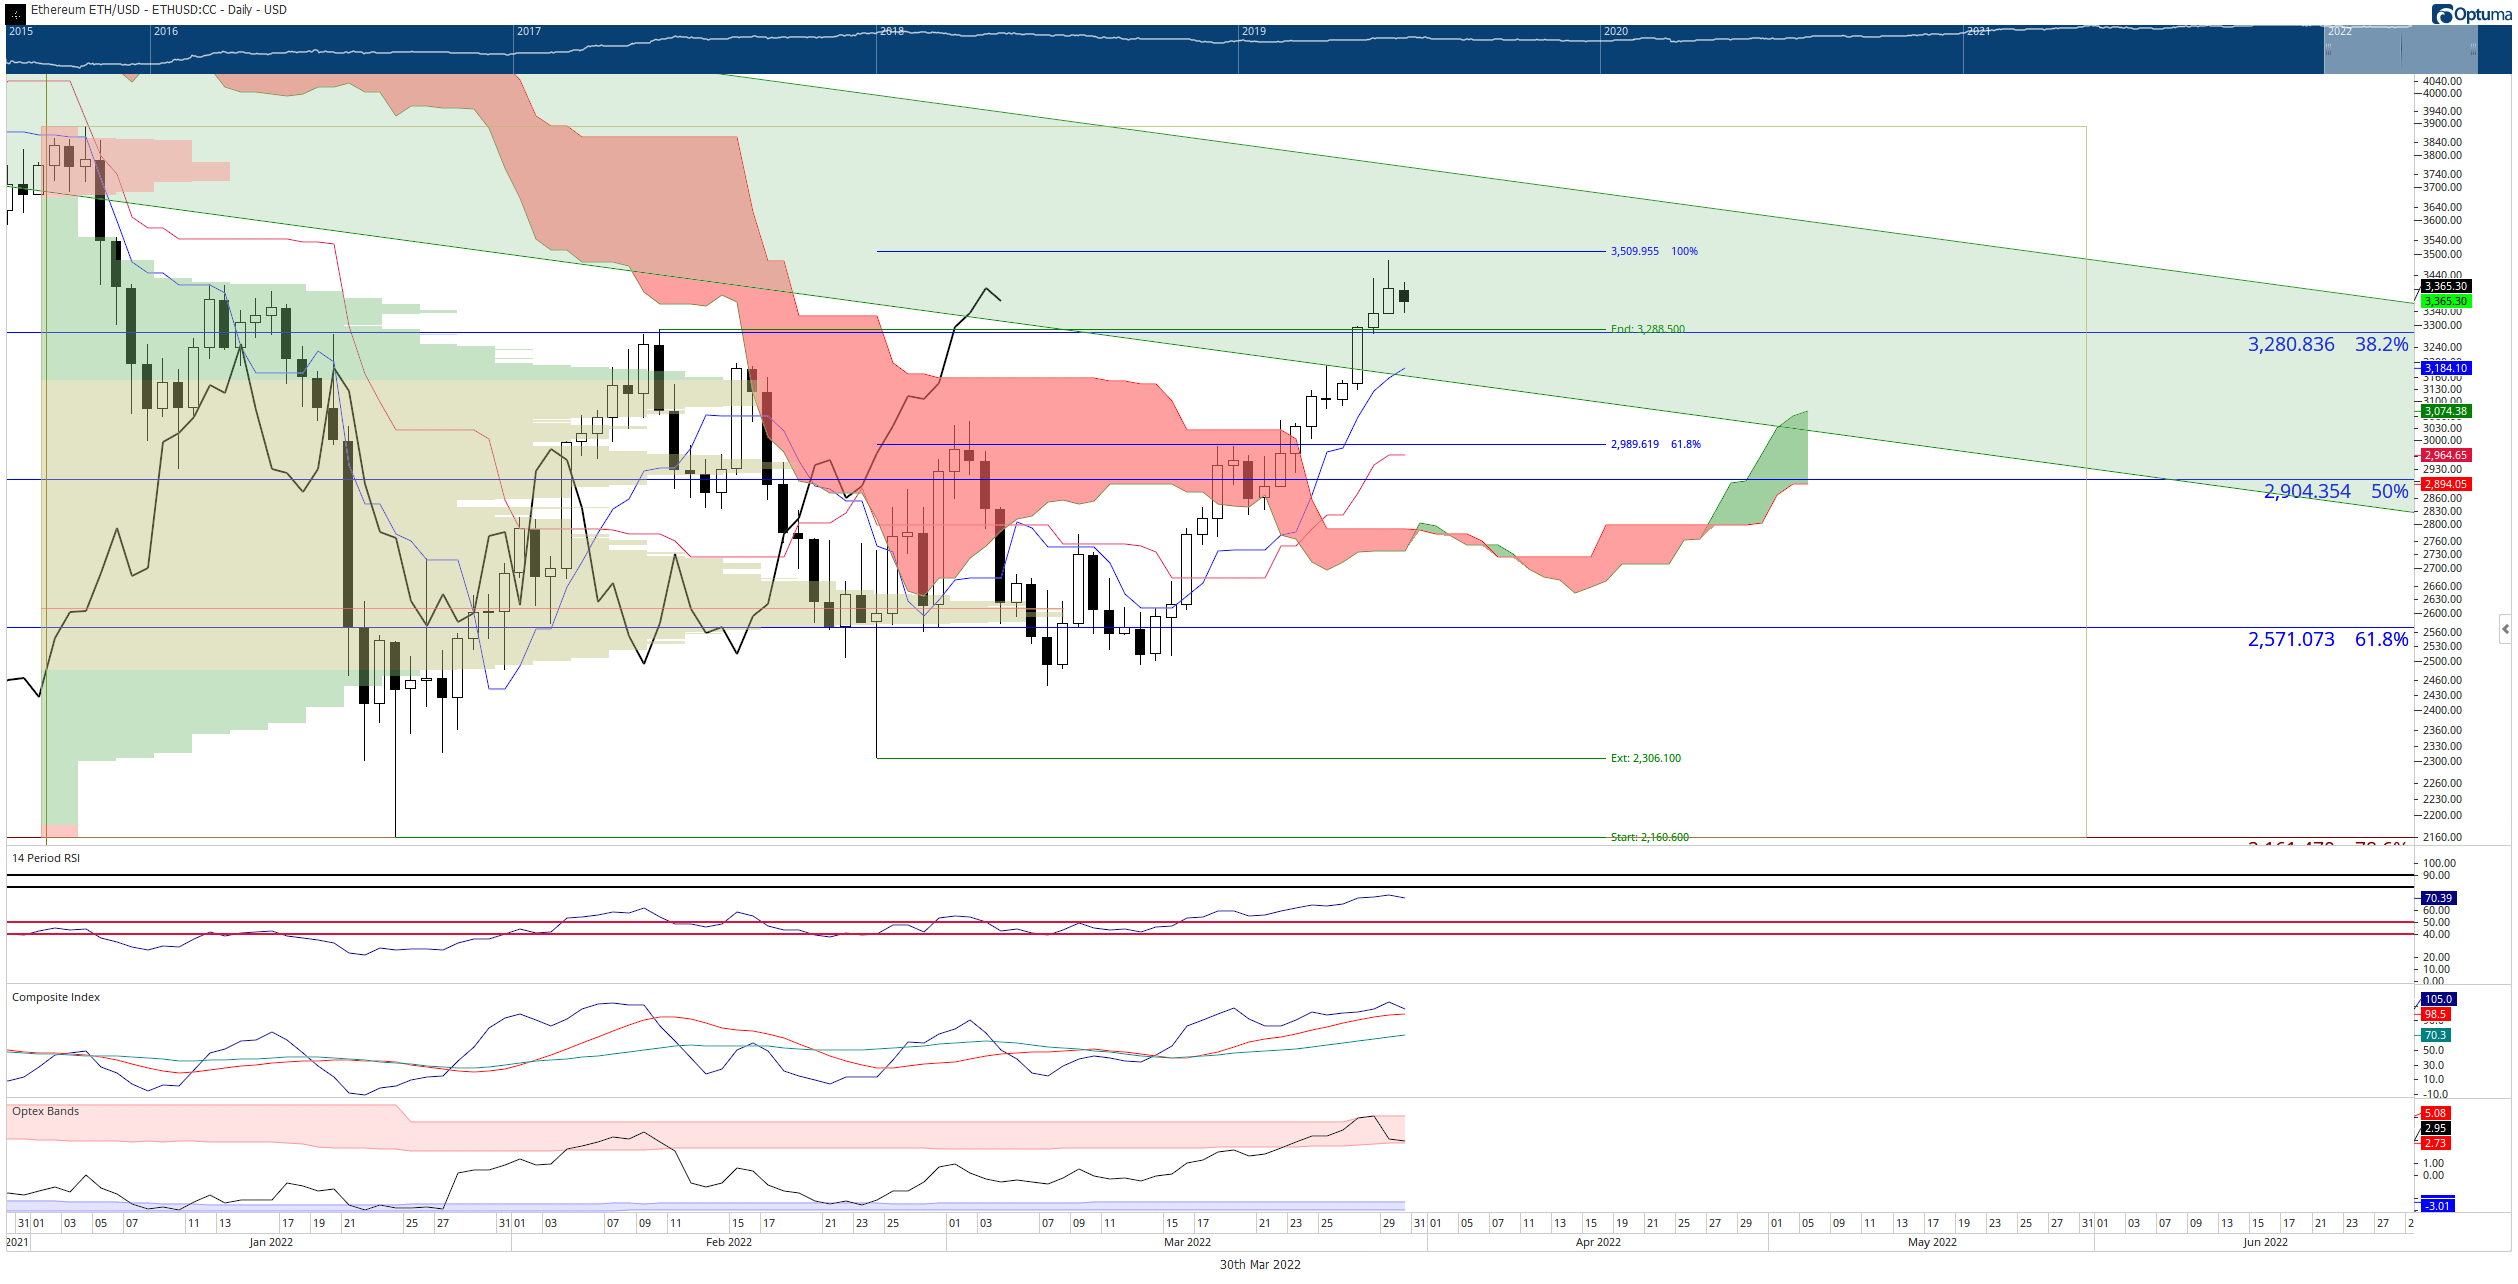
ETH/USD Daily Ichimoku Kinko Hyo Chart
Downside risks for Ethereum price should be limited to the $3,000 value area, where the 50% Fibonacci retracement and daily Kijun-Sen exist.
Author

Jonathan Morgan
Independent Analyst
Jonathan has been working as an Independent future, forex, and cryptocurrency trader and analyst for 8 years. He also has been writing for the past 5 years.



