|

Polkadot Price Prediction: Sneaky bears aim for $4 [Video]

  • Polkadot price has lost support from the 8- and 21-day simple moving averages. 
  • DOT price shows an uptick in bearish momentum on the volume profile indicator.
  • Invalidation of the bearish thesis is a breach above $10.

Polkadot price shows the possibility of a decline targeting $4. Key levels have been identified. 

Polkadot price points south

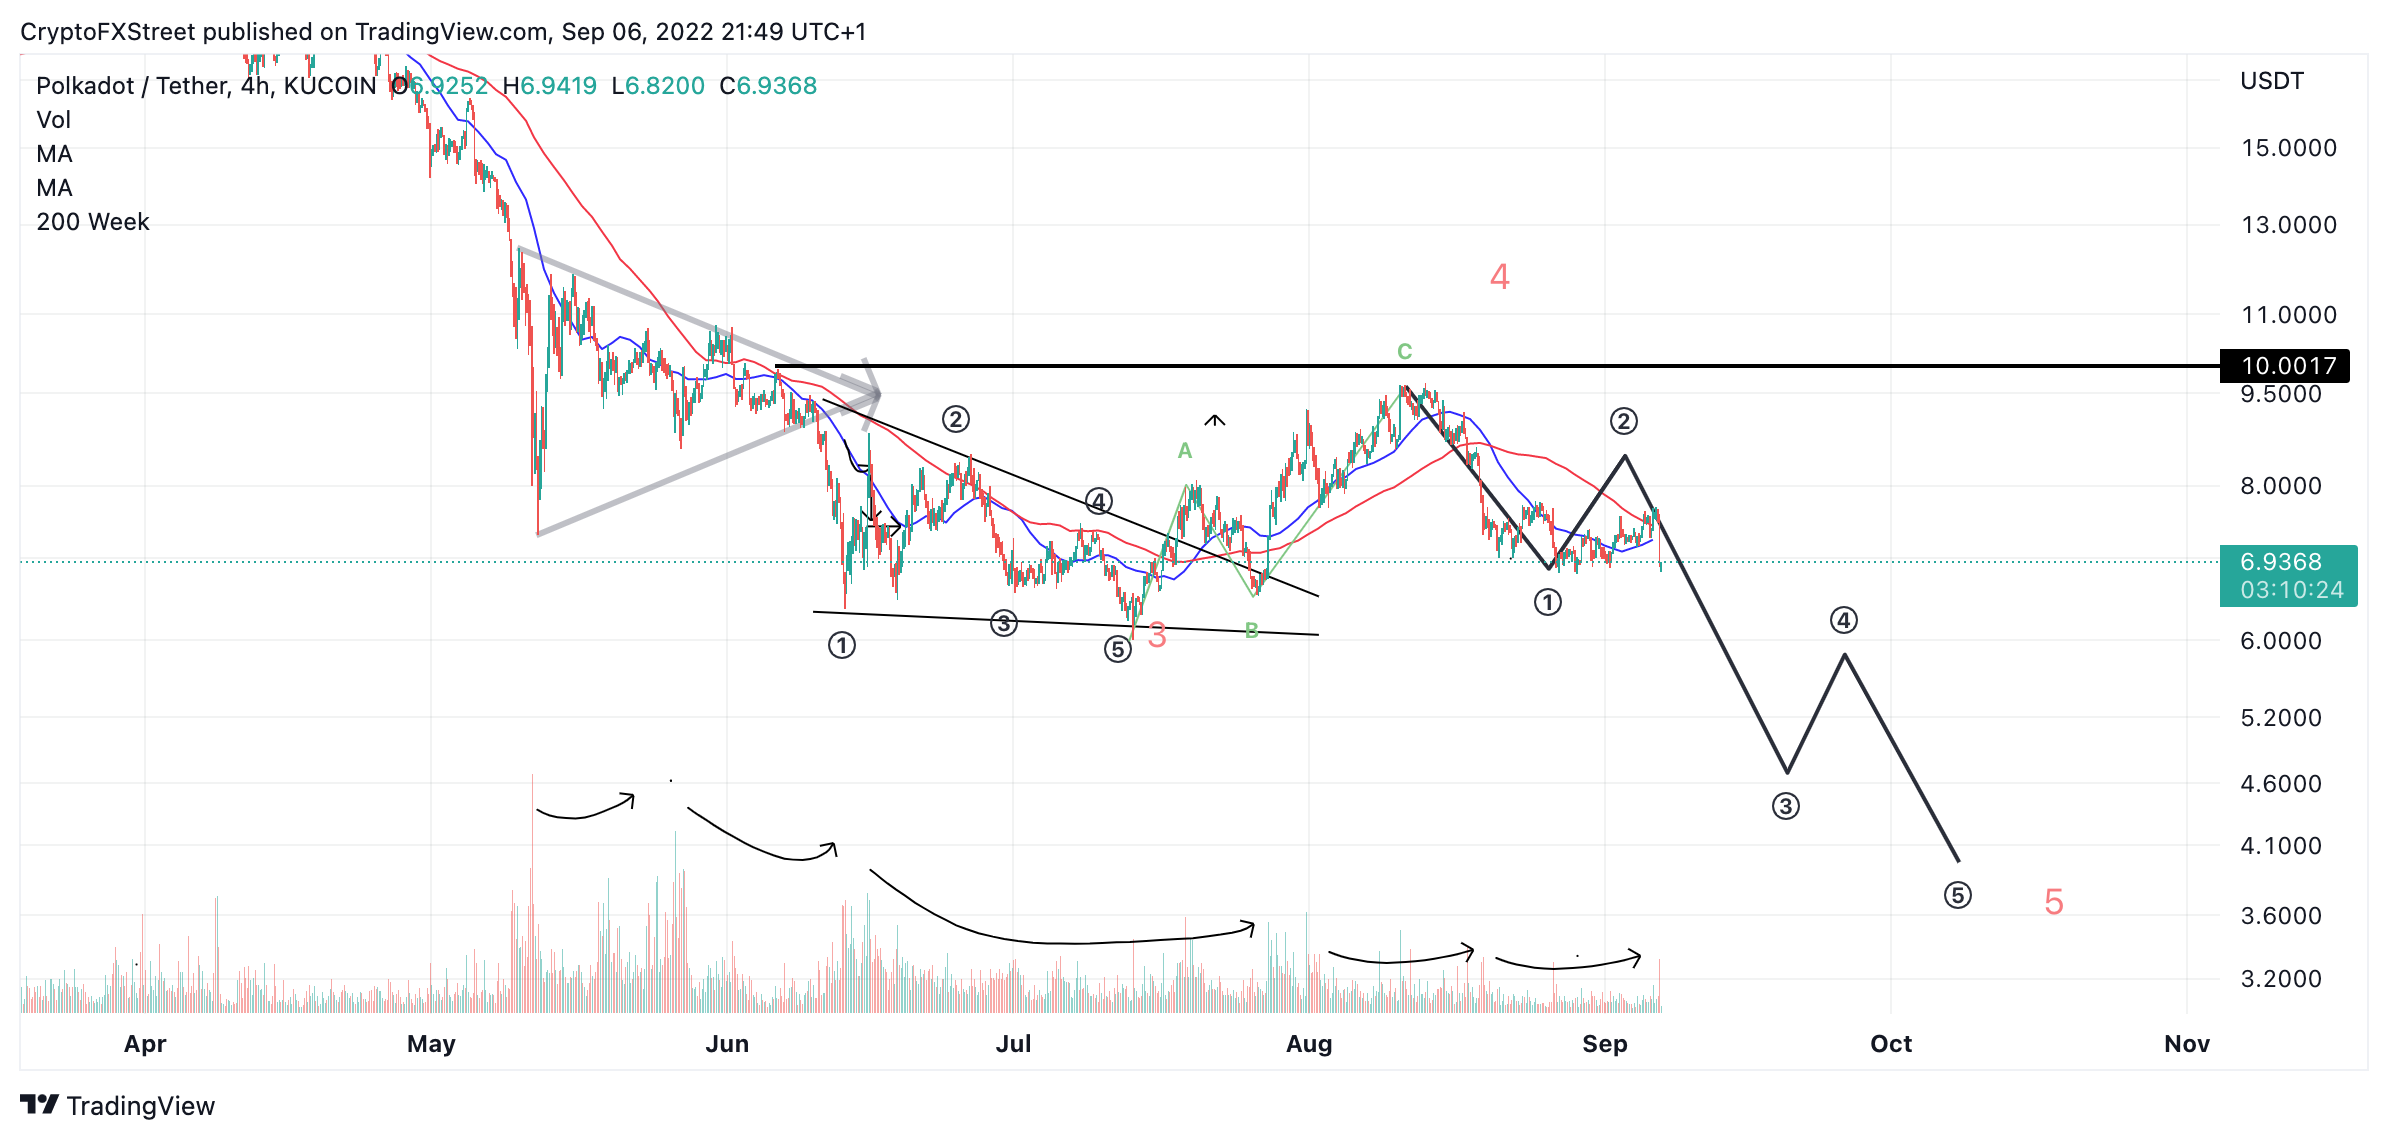
Polkadot price shows bearish technicals to start the first trading week of August. On Tuesday, September 6, the Polkadot price was rejected from both the 8- and 21-day simple moving averages. This could be viewed as early evidence of a much larger decline.

Polkadot price currently auctions at $6.90. An Elliott Wave forecast projects bearish targets between $4.50 and $3.00 if the bears genuinely control the trend. The Volume Profile Indicator confounds the bearish idea as an uptick of transactions has been spotted amidst the rejection from the moving averages.
tm/dot/9/6/22

DOT USDT 

Despite the bearish outlook, traders should still practice caution, as smart money fakeouts are always possible in the crypto space. Traders should also expect a potential liquidity hunt targeting $8.00 for a 22% increase from the current price. However, such a move would not invalidate the overall bearish thesis.

The safest invalidation is at $10.00. This creates a conventional 1-1 trade setup that could yield healthy returns in the coming weeks.

In the following video, our analysts deep dive into the price action of Polkadot, analyzing key levels of interest in the market. -FXStreet Team

Author

Tony M.

Tony M.

FXStreet Contributor

Tony Montpeirous began investing in cryptocurrencies in 2017. His trading style incorporates Elliot Wave, Auction Market Theory, Fibonacci and price action as the cornerstone of his technical analysis.


More from Tony M.
Share:

Editor's Picks

Top 3 Price Predictions: BTC, ETH and XRP rebound as major support levels cap recent sell-off

Bitcoin, Ethereum and Ripple rebound modestly on Friday after correcting and testing their key support zone the previous day. BTC holds the 50-day Exponential Moving Average, ETH finds support around the 100-day EMA, while XRP holds the horizontal floor near $1.300.

Why Hyperliquid is losing RWA market share to centralized exchanges

Hyperliquid (HYPE) is losing market share in real-world asset perpetual futures to centralized exchanges even as the overall financial market faces pressure. Hyperliquid’s trade.xyz accounted for roughly 80% of RWA perpetual trading volume in July, according to Artemis data shared by Ark Invest Digital Asset Head of Research Lorenzo Valente..

Cardano Price Forecast: Whale selling deepens ADA correction

Cardanoedges higher by nearly 2% on Friday, following a roughly 6% decline the previous day. The pullback aligns with the sell-side appeal among large-wallet investors, commonly referred to as whales, and Cardano derivatives. The technical outlook for ADA is bearish, with downside momentum persisting. Whales are losing their appetite for holding ADA tokens, fueling near-term selling pressure.

Bitcoin falls 4% as chip stocks plunge 6.7% and oil surges
Bitcoin (BTC) fell below $82,000 on Thursday as the crypto market joined a broader market sell-off driven by concerns over artificial intelligence (AI) spending, rising oil prices and escalating geopolitical tensions involving the US and Iran. The top crypto fell 4% to $81,130 as macro fears weighed on prices across the digital asset market.
Bitcoin: Macroeconomic headwinds, cooling demand cap BTC gains
Bitcoin (BTC) extends losses this week, trading below $82,500 as of Friday as selling pressure continues. Weakening institutional demand supports this pullback as BTC spot Exchange-Traded Funds (ETFs) are on track to record a two-week withdrawal streak, reaching $146.19 million in net outflows through Thursday.