Polkadot Price Prediction: One more pump then dump at best
- Polkadot price coils in what appears to be a triangle consolidation.
- DOT price hovers above an ascending trendline under relatively low volume.
- A breach of the $6 barrier could send DOT 40% lower into the $4.25 zone.

Polkadot price could bounce near this level, but the technicals suggest a larger selloff is coming.
Polkadot price is on thin ice
Polkadot price shows reasons to be concerned as the bears are hours away from printing a classical shooting star reversal pattern on a 3-day chart. The last time the classic reversal pattern formed was a month ago, on August 14, near the $9 barrier. DOT price declined by 15% three days later as the bears wasted no time validating the reversal pattern’s power.
Polkadot price currently auctions at $6.73, about 23% lower than the first morning star pattern in August. The bulls have to stair-stepped into supportive territory on the Relative Strength Index, while the volume profile remains less than the previous bull run's reading in July.
DOT USDT
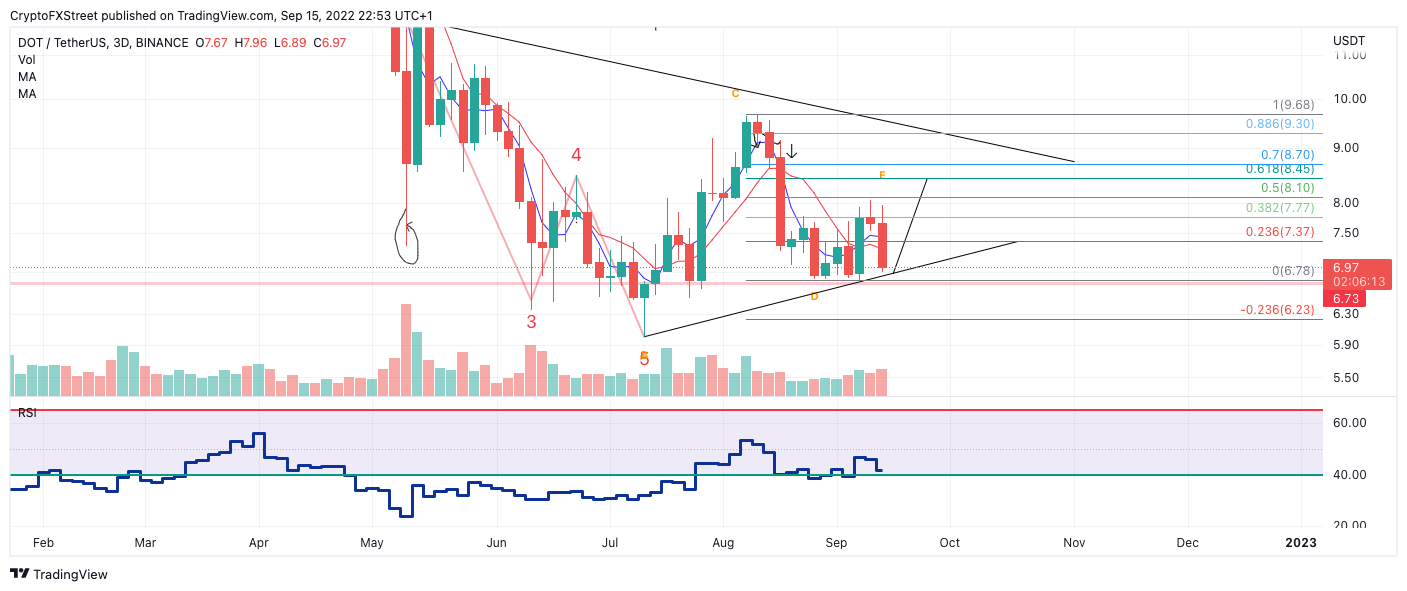
A Fibonacci retracement tool surrounding the summer time high at $9.678 and September low at $6.78 shows the shooting star pattern occurring near the 50% and 38.2% levels. If the technicals are truly bearish, the bears should be able to breach the supportive trend line that currently supports the Polkadot price.
If the bears do not establish the breach soon, one more wave up could occur towards the 61.8% retracement level at $8.45. Such a move would be a 20% increase from the current market value.-
However, traders should remember that one last wave up could finalize wave E of the much larger triangle formation at play. If the technicals are correct, the triangle could catalyze a much larger decline targeting $4.25 as early as Q1 2023.
In the following video, our analysts deep dive into the price action of Polkadot, analyzing key levels of interest in the market. -FXStreet Team
Author

Tony M.
FXStreet Contributor
Tony Montpeirous began investing in cryptocurrencies in 2017. His trading style incorporates Elliot Wave, Auction Market Theory, Fibonacci and price action as the cornerstone of his technical analysis.


