Why MATIC price could soon see a meteoric rise toward the round level of $4
- MATIC price is preparing for a 62% surge toward $3.84 following its swift recovery.
- The bulls are eyeing a massive rally for Polygon as it targets to set a new record high.
- MATIC must sustain above $2.24 in order for the optimistic target to be reached.

MATIC price appears to be ready for a major upswing toward $3.84 as Polygon presented a bullish chart pattern on the daily chart. The governing technical pattern suggests that the layer-2 token is preparing for a 62% climb.
MATIC price gears up for 62% ascent
MATIC price has formed an ascending triangle on the daily chart, presenting a bullish target at $3.84, a 72% climb from the upper boundary of the governing technical pattern.
On December 7, MATIC price sliced above the topside trend line of the prevailing chart pattern, validating the bullish outlook. However, Polygon may face a few obstacles ahead before reaching the optimistic target.
The first hurdle appears at the May 26 high at $2.44, then at the all-time high at $2.70. MATIC price may face headwind at the 127.2% Fibonacci extension level at $3.25, before reaching the bullish target at $3.84. Bigger aspirations may even target the 161.8% Fibonacci extension level at $3.96.
However, in order for the prevailing chart pattern to be robust, MATIC price must sustain above $2.24, the upper boundary of the triangle that acts as the first line of defense for Polygon, coinciding with the 78.6% Fibonacci retracement level.
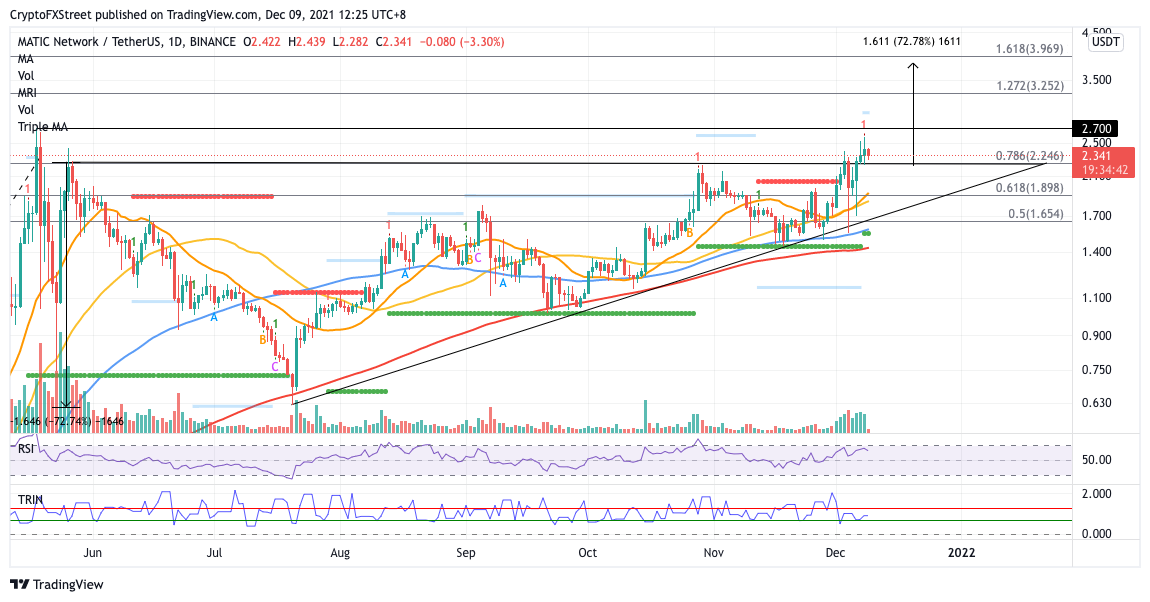
MATIC/USDT daily chart
MATIC price may discover an additional foothold at the 21-day Simple Moving Average (SMA) at $1.89, which intersects with the 61.8% Fibonacci retracement level. If selling pressure were to increase, Polygon may drop toward the 50-day SMA at $1.81, then toward the lower boundary of the triangle at $1.65, which sits near the 50% retracement level.
Investors should note that dropping below the aforementioned foothold may spell trouble for the bulls, as Polygon would be losing a critical multi-month support trend line, and the bullish forecast may be voided.
Author

Sarah Tran
Independent Analyst
Sarah has closely followed the growth of blockchain technology and its adoption since 2016.


