Why investors should expect double digit corrections in altcoins this week
- With spot ETF hype inflating crypto market prices, investors need to be cautious of a correction.
- If the US SEC does not approve spot ETFs as speculated by analysts, altcoins are likely to bleed.
- Three altcoins that are likely to suffer steep, double-digit corrections are Celestia, Solana and THORChain.

Bitcoin price has remained relatively stable as investors are enjoying free altcoin gains due to the ETF hype. While the rally is interesting to watch, traders need to be cautious of a potential correction that could catch them off guard.
Bitcoin ETF window and its effect
Analysts speculate that the ETF approval window that lasts till November 17 could see all 12 filed ETFs get batch approval from the United States Securities and Exchange Commission (SEC). The analysts note that the chances of an ETF approval in November are high due to two reasons.
- The final deadline of some ETFs makes it impossible for the SEC to delay them to a future date.
- The government shutdown in December due to the holidays.
Hence, should a spot ETF approval come this week, it would cause an upheaval and major buying frenzy among all sectors of the crypto ecosystem. On the off chance that this ETF is unapproved, investors can expect the sideways movement in Bitcoin price to develop into a correction.
Also read: Week Ahead: Bitcoin ETF approval this week, yay or nay?
Bloomberg Analyst James Seyffart noted that the “Bitcoin ETF approvals for this wave” is “more likely to happen closer to January than this current window.”
So, in the event that a correction does ensue, investors betting on altcoins should be extra cautious. These cryptos that have rallied egregiously over the past few days could see steep corrections across the board.
As an example, altcoins quickly posted double-digit losses when Bitcoin price slid roughly 6% on November 9.
Read more: Bitcoin Weekly Forecast: BTC crashes ahead of ETF approval window, but bull run is not under threat
Three altcoins to watch: Celestia, Solana and THORChain
Celestia (TIA) price rallied 145% in under three days between November 10 and 13. This uptick has not formed a local top around $5.97 and shows signs of correction.
Over the last 24 hours, TIA has dropped nearly 23% and has also undone this loss after a 27% rally in the last four hours.
This massive uptick has now tagged a daily imbalance around the $5.65 level, suggesting a potential reversal. Daily imbalance is when the price moves rapidly in a single direction not allowing buy and sell orders to be delivered in a balanced manner.
The hourly Relative Strength Index (RSI) has dipped from the overbought condition to below the 50 mean level. While RSI is attempting to overcome the midpoint, a failure could see it slide into the oversold level.
From the current position of $5.38, TIA could shed 30% and tag the four-hour support level at $3.76.
In some cases, it could dip as low as $3.48, clocking in a 35% pullback.
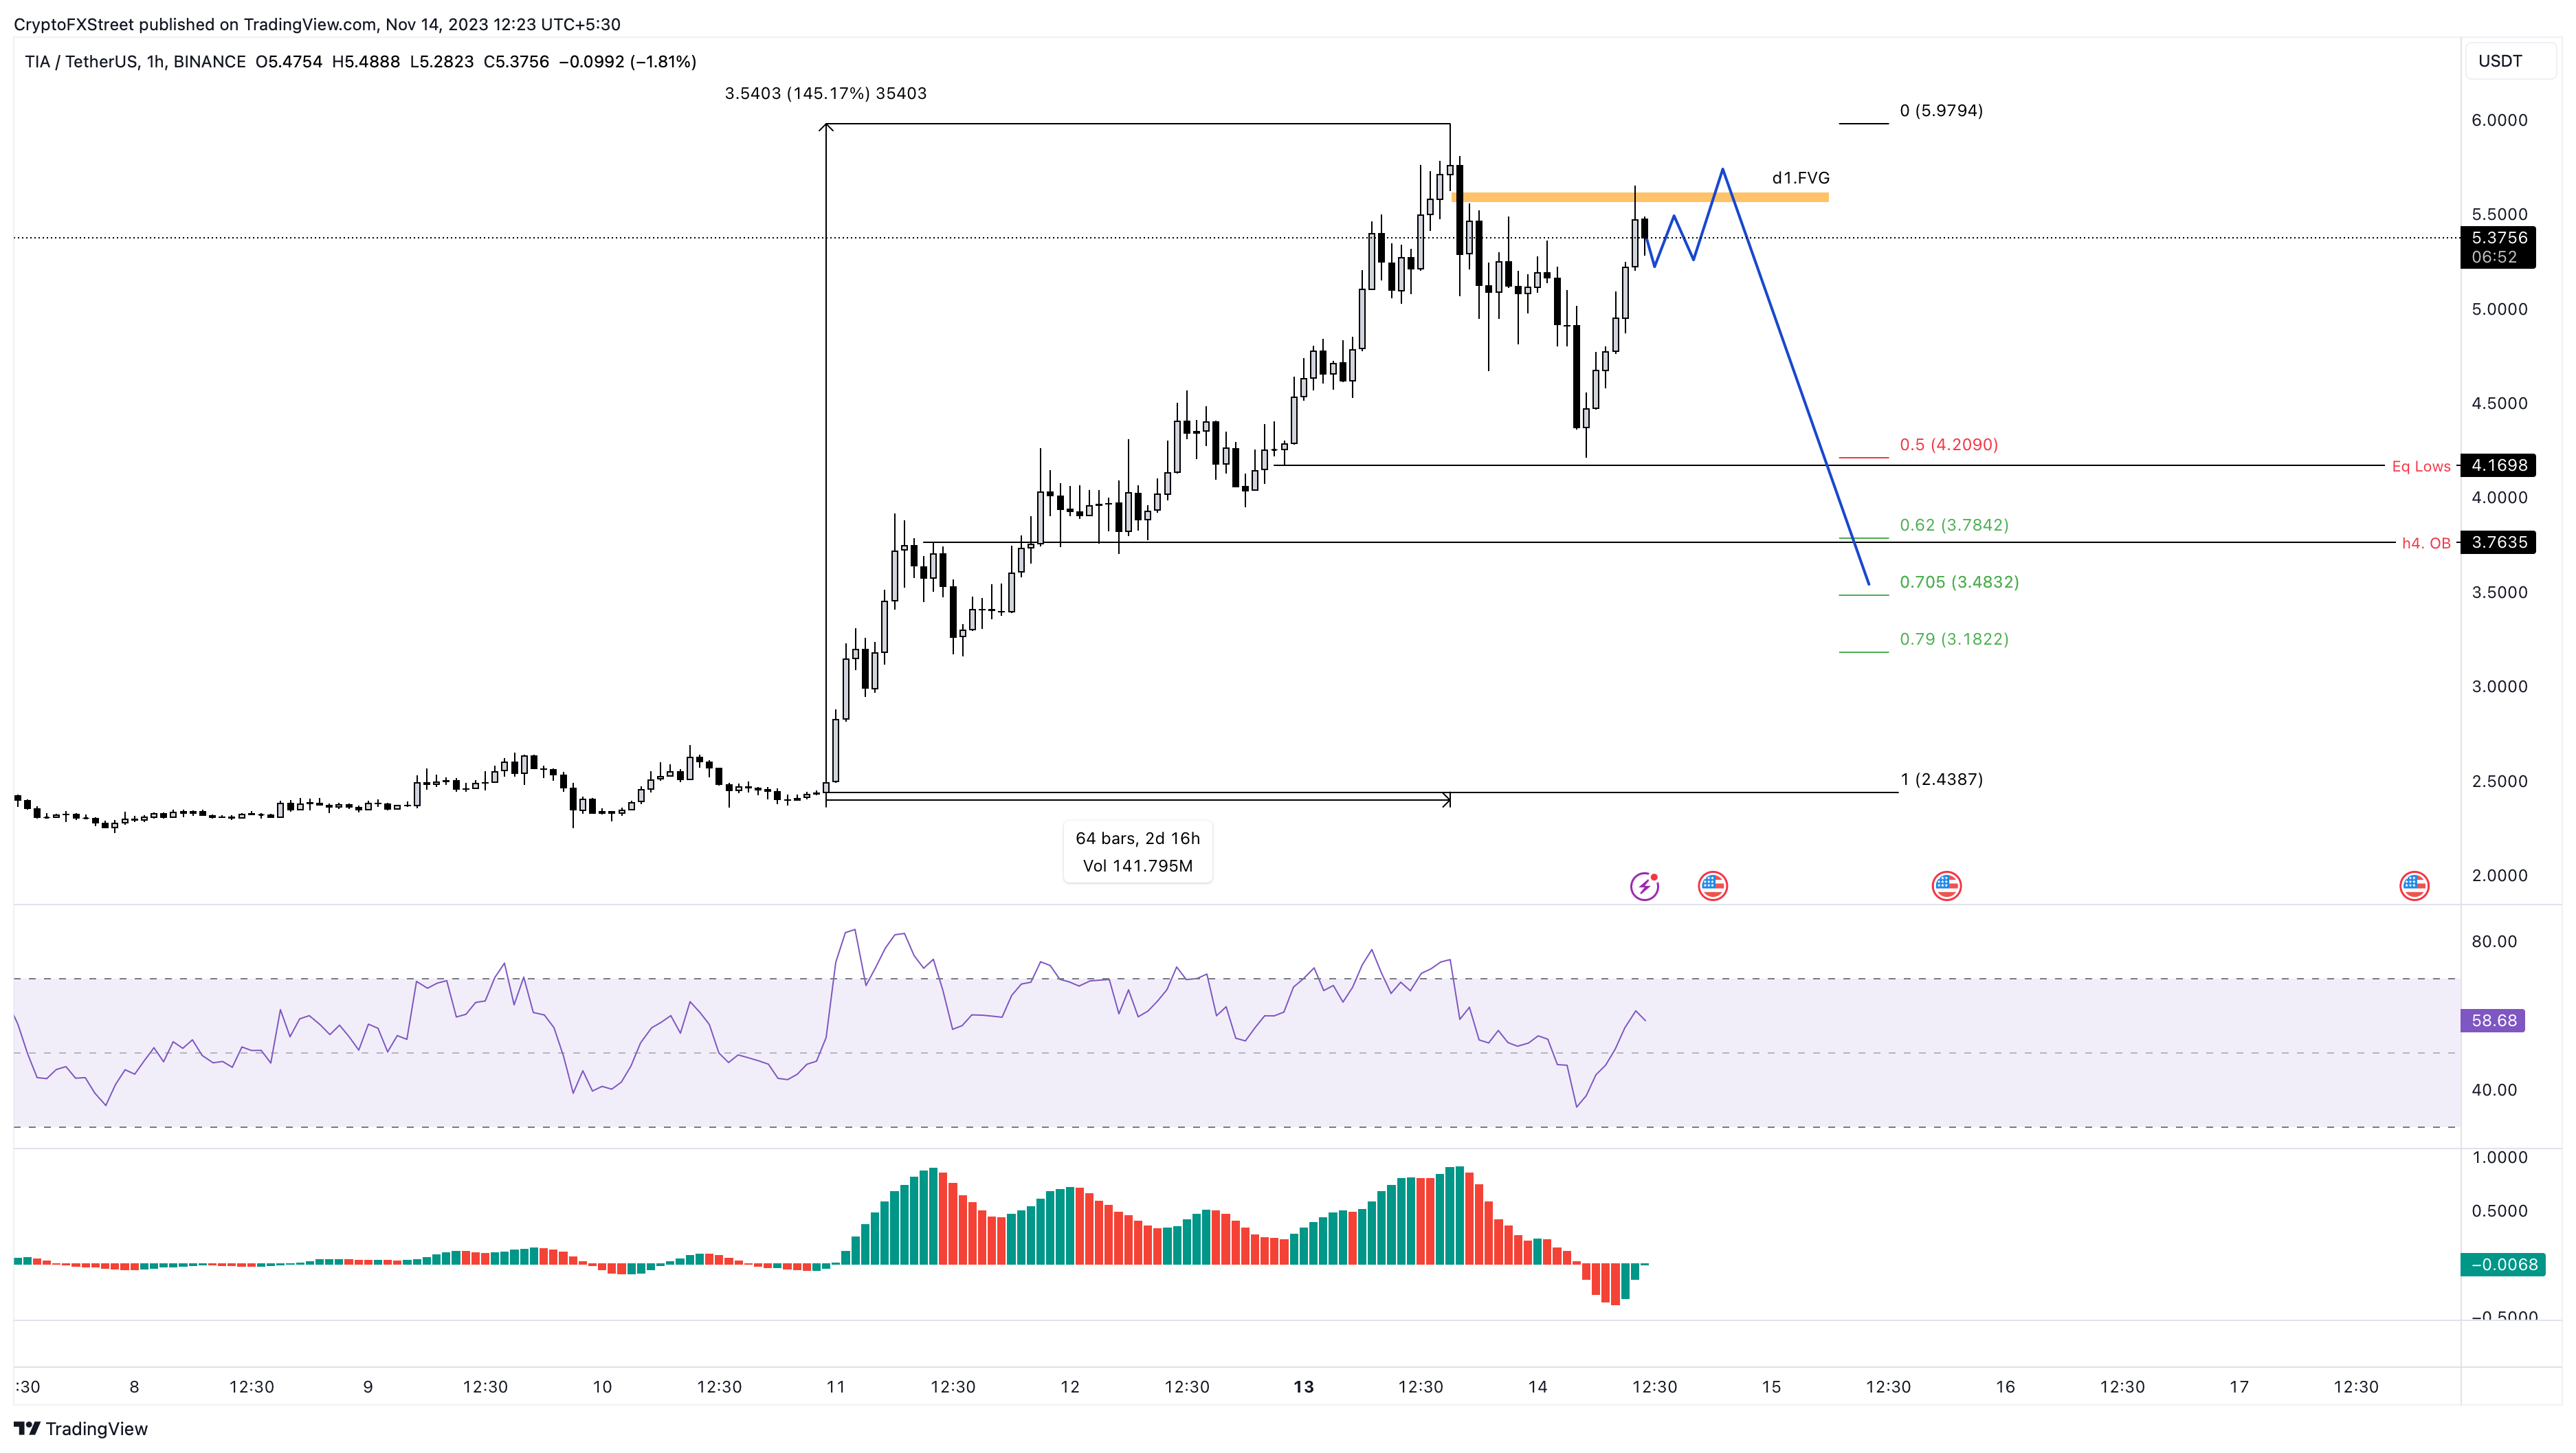
TIA/USDT 1-hour chart
Solana (SOL) price has a clear short setup with the formation of a bearish breaker pattern on the 4-hour chart. The breaker zone extends from $53.55 to $57.70, around the last higher low of the prior uptrend. It acts like a flipped demand zone providing resistance to the new downtrend. A rejection inside the breaker often indicates a deeper correction.
In this case, SOL could see a retest of the breaker’s midpoint at $55.62 and trigger either:
- A 20% correction to the immediate support level at $44.38.
- If the selling pressure is high, SOL could drop down to the 62% retracement level at $37.28, constituting a 33% crash.
- The worst-case scenario would include a 40% crash to the $32.76 support level.
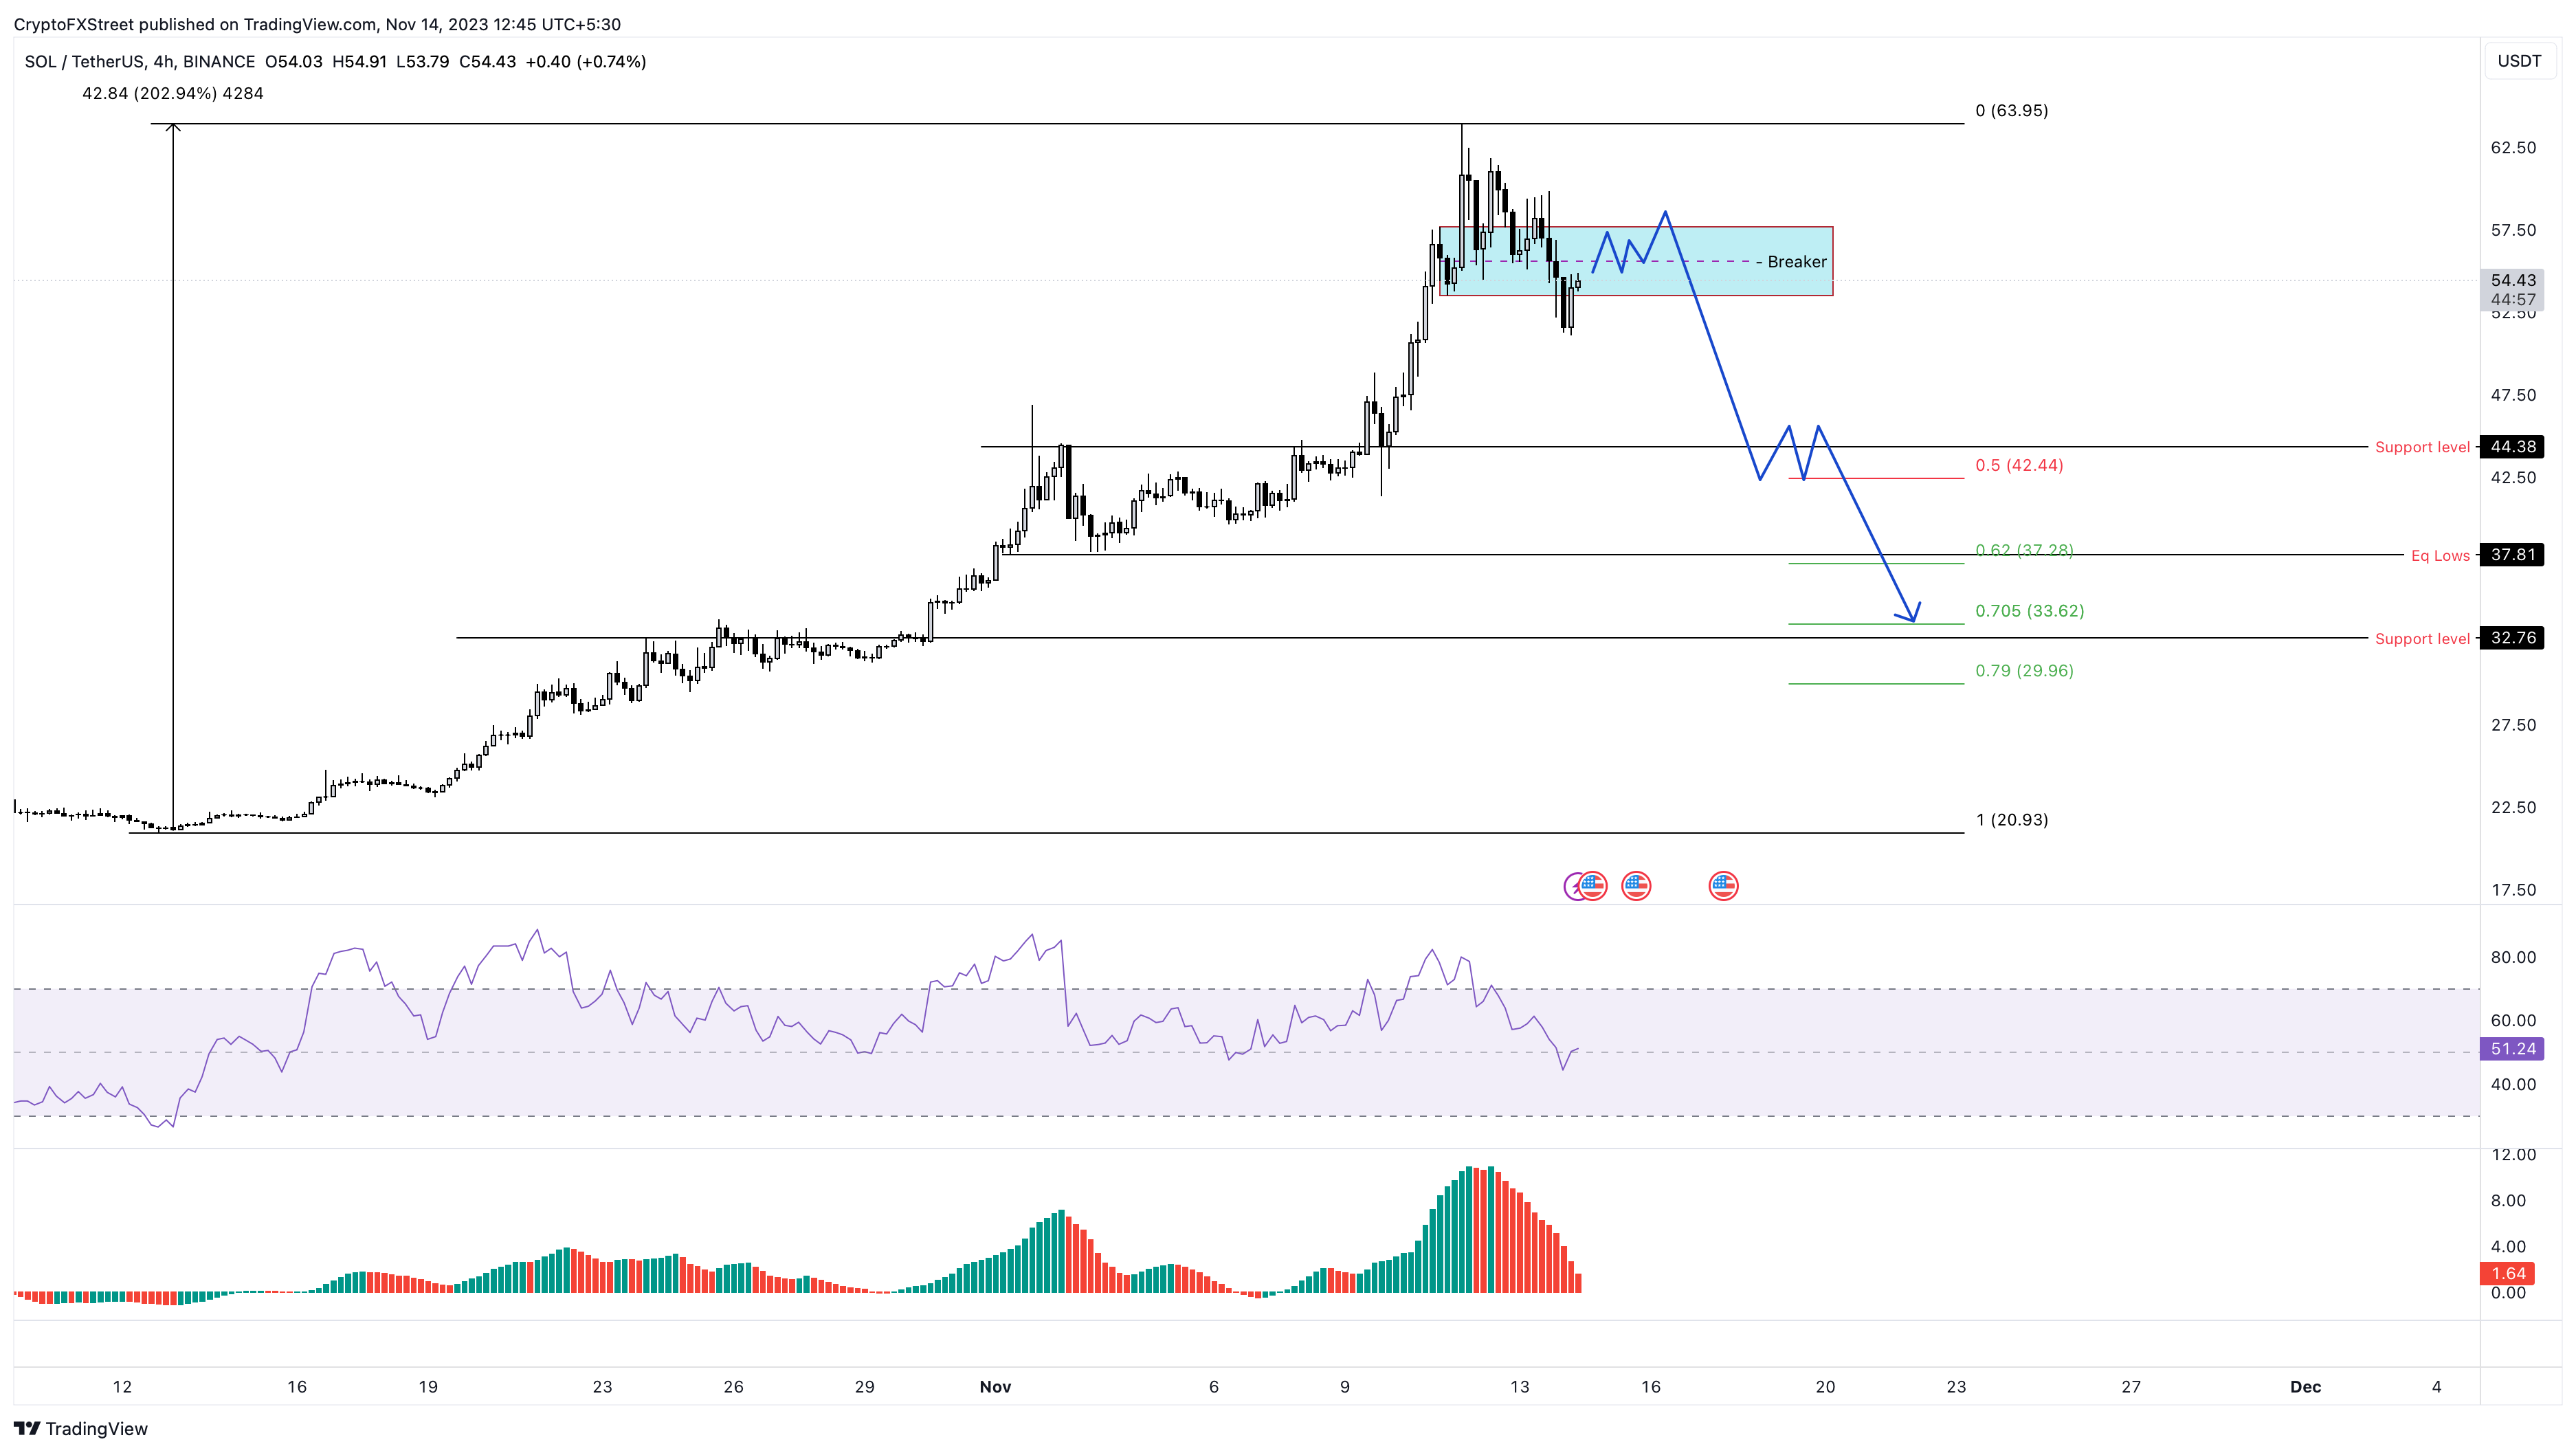
SOL/USDT 4-hour chart
THORChain (RUNE) price is recovering and could retest the recent former support level which has been flipped into resistance at $5.07. This could trigger either:
- A 15% correction to the $4.31 support level.
- A 32% correction to the $3.44 support level, which is the midpoint of the 235% rally observed between October 20 and November 12.
- A 41% correction to the $2.97 support level.
- A 48% correction to the $2.64 support level.
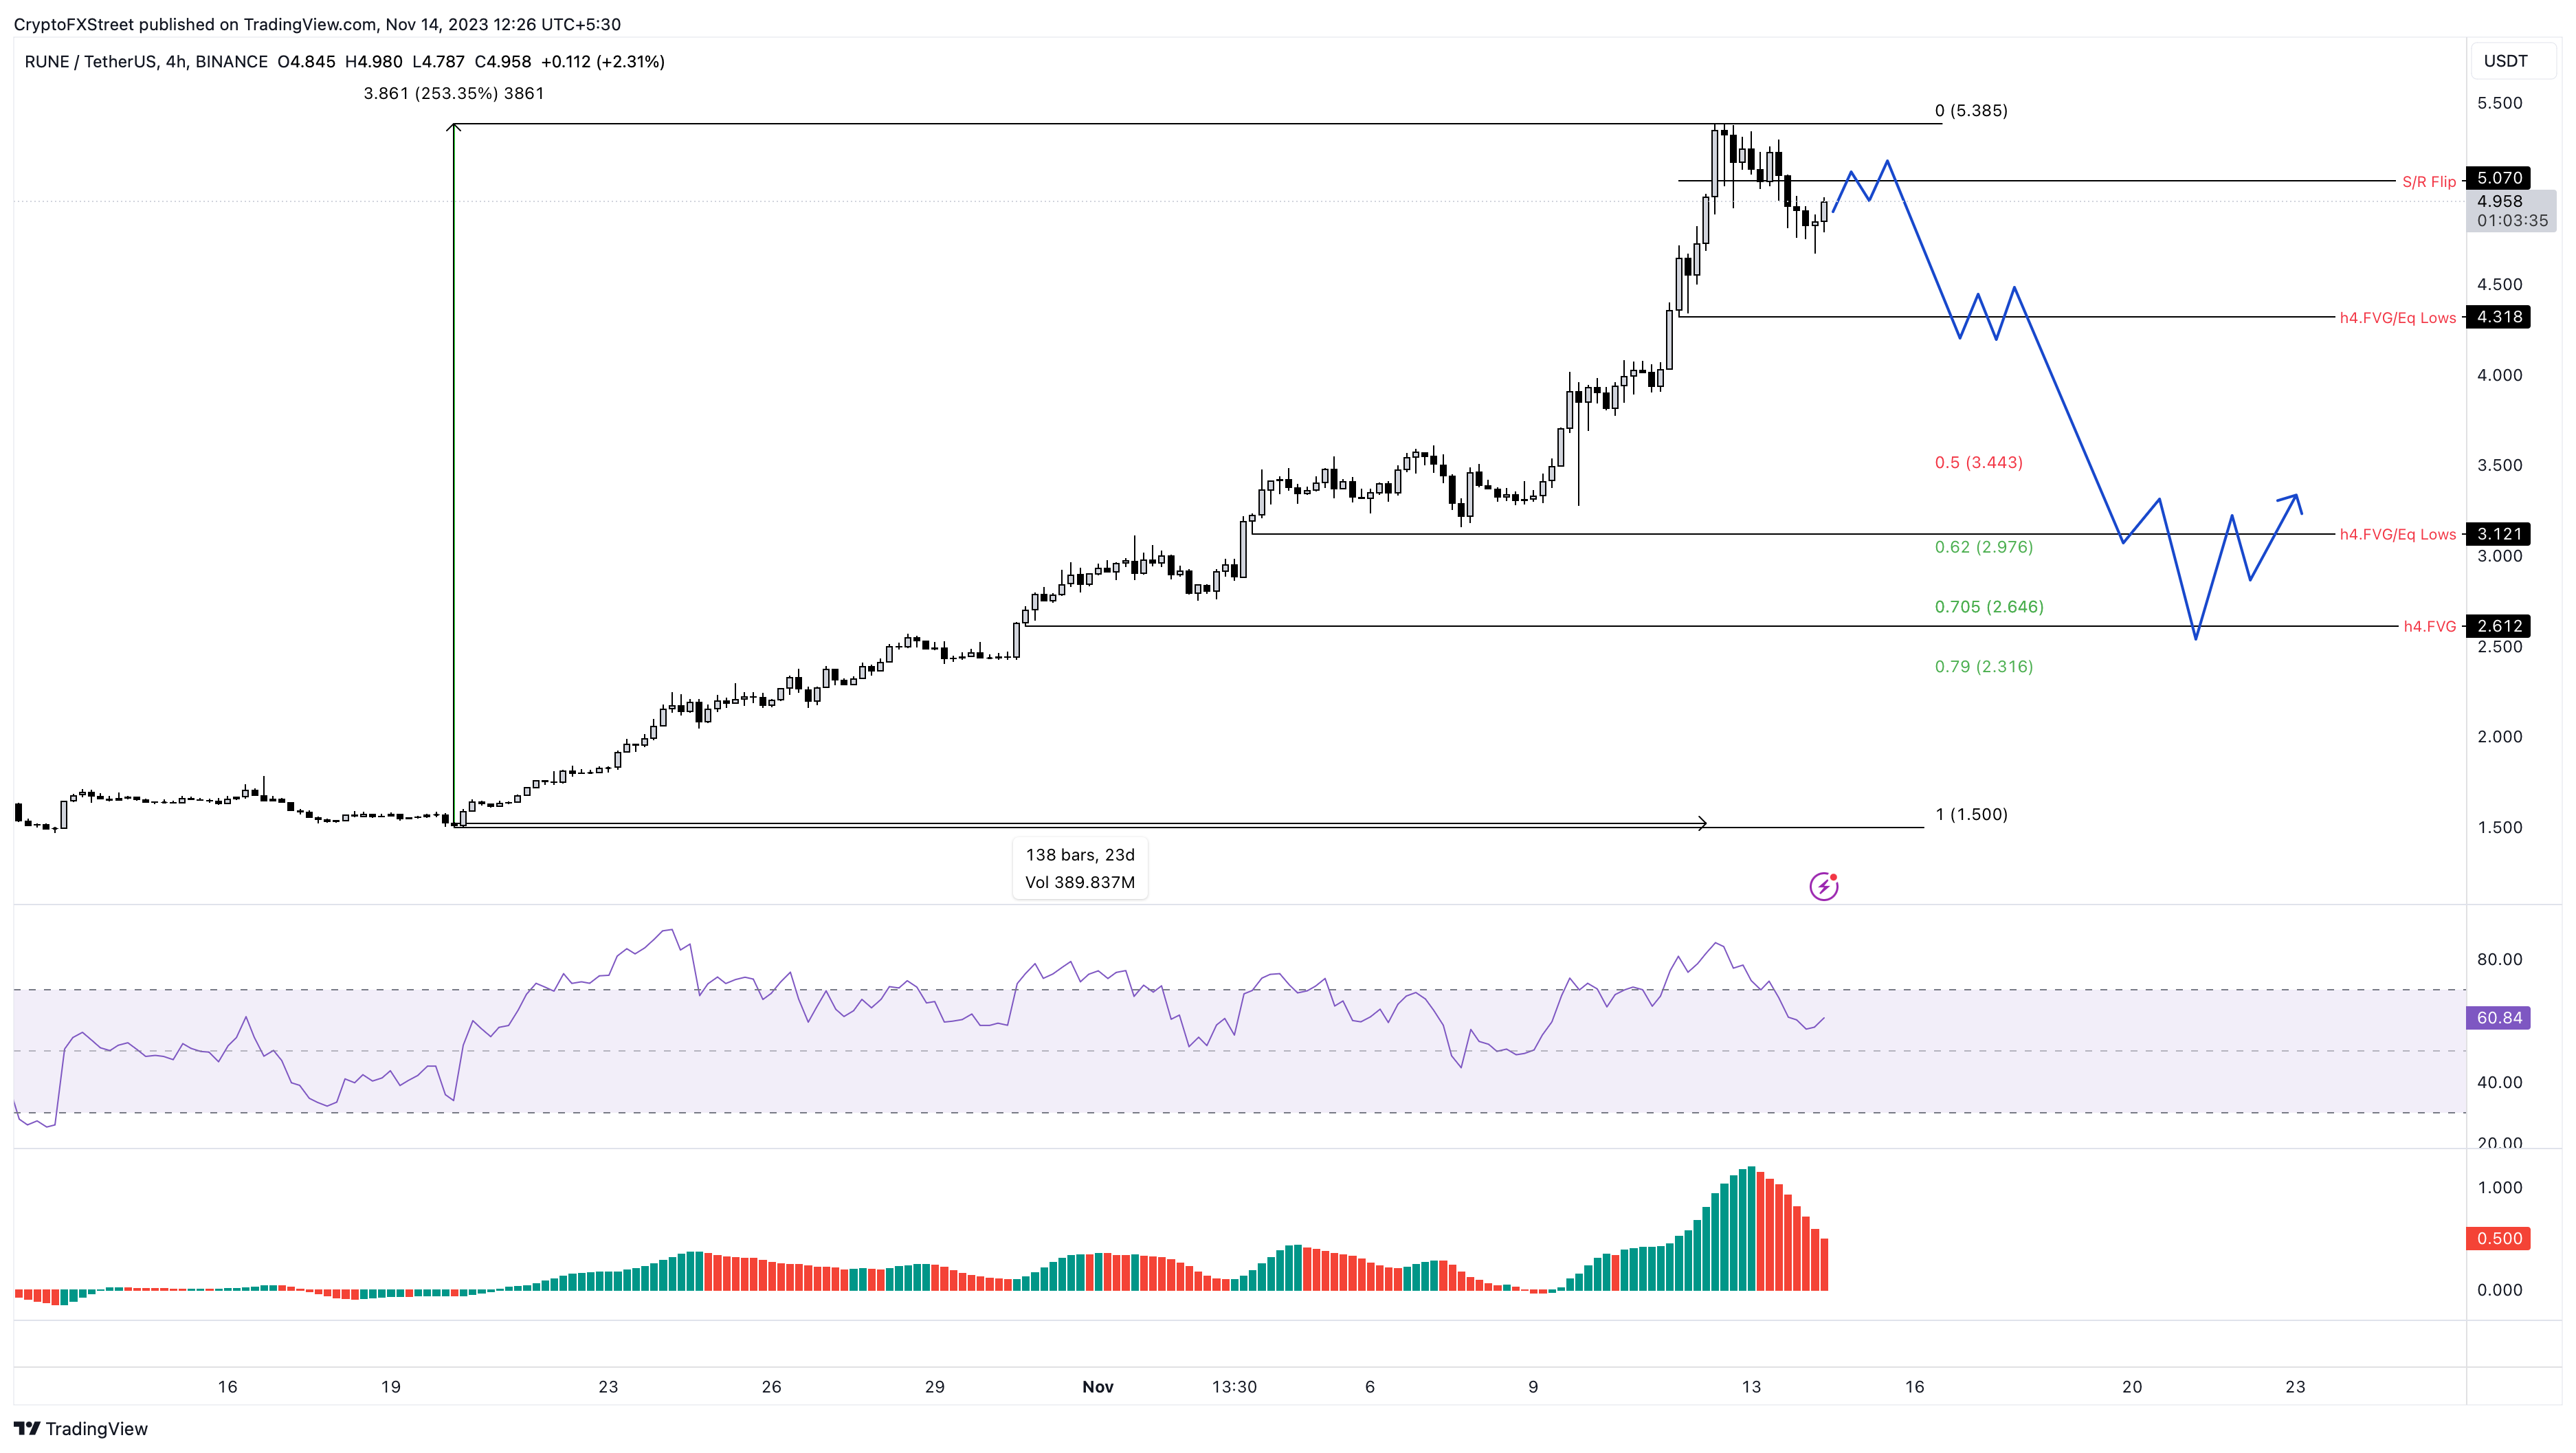
RUNE/USDT 4-hour chart
Author

Akash Girimath
FXStreet
Akash Girimath is a Mechanical Engineer interested in the chaos of the financial markets. Trying to make sense of this convoluted yet fascinating space, he switched his engineering job to become a crypto reporter and analyst.


