Bitcoin Weekly Forecast: BTC crashes ahead of ETF approval window, but bull run is not under threat
- Bitcoin price on the weekly time frame forecasts a potential correction to $34,000.
- The daily chart also flashed a triple bearish divergence that echoes the sell signal on the weekly.
- While the short-term outlook pines for a correction, the long-term outlook remains bullish.

Bitcoin (BTC) price shows signs of slowing down after Thursday’s sudden sell-off that wiped out more than a billion dollars in open interest and hundreds of millions in liquidations. While this caused many altcoins to suddenly crash double digits – before then recovering quickly – others continue to face immense selling pressure. Despite the recent debacle, investors remain optimistic and expect the 2023 rally to continue.
Read more: Breaking: Bitcoin price crashes 8%, wiping out $1 billion in open interest
Bitcoin spot ETF approval window
The approval of a spot Bitcoin ExchangeTraded Fund (ETF) has been the talk of the town in 2023. After multiple delays and no-shows, Grayscale’s victory against the United States Securities and Exchange Commission (SEC), has increased the odds of approval, suggesting even that it might be fast-tracked.
As of November 8, the ETF approval window has opened and extends all the way up to November 17.
As described by Bloomberg’s research analyst James Seyffart, the “ETF window” is when the SEC needs to provide rebuttal comments for delays or rejections for ETF applications. The regulator, which previously declined all 12 applicants’ ETF filings, is now set to provide rebuttal comments or approve them.
In a recent note, James Seyffart added,
A brief window opens on Nov. 9 for the SEC to potentially approve all 12 US spot Bitcoin ETF applicants, including Grayscale's GBTC. It will be open for at least eight days. Even if approvals don't arrive this month, we still believe there's a 90% chance of approval by Jan. 10.
Experts argue that if the approval does come, it will be for all 12 applicants. But a silver lining to this development is that despite the ETF approval, it will take at least a month before the spot ETF launches.
ETF window or not, Bitcoin price has rallied in anticipation of this approval.
Also read: Ethereum price breaks past $2,000 as BlackRock hints at filing for spot Ether ETF
BTC front-runs ETF approval
Bitcoin (BTC) price has front-run the ETF approval news, leading to 121% year-to-date returns. Going forward, it is likely to do the same especially considering the SEC’s position and the ETF approval window.
On November 9, there was a sudden 6% sell-off, which wiped out $1.6 billion in open interest. In total, November 9 saw liquidations totalled nearly $500 million according to CoinGlass data.
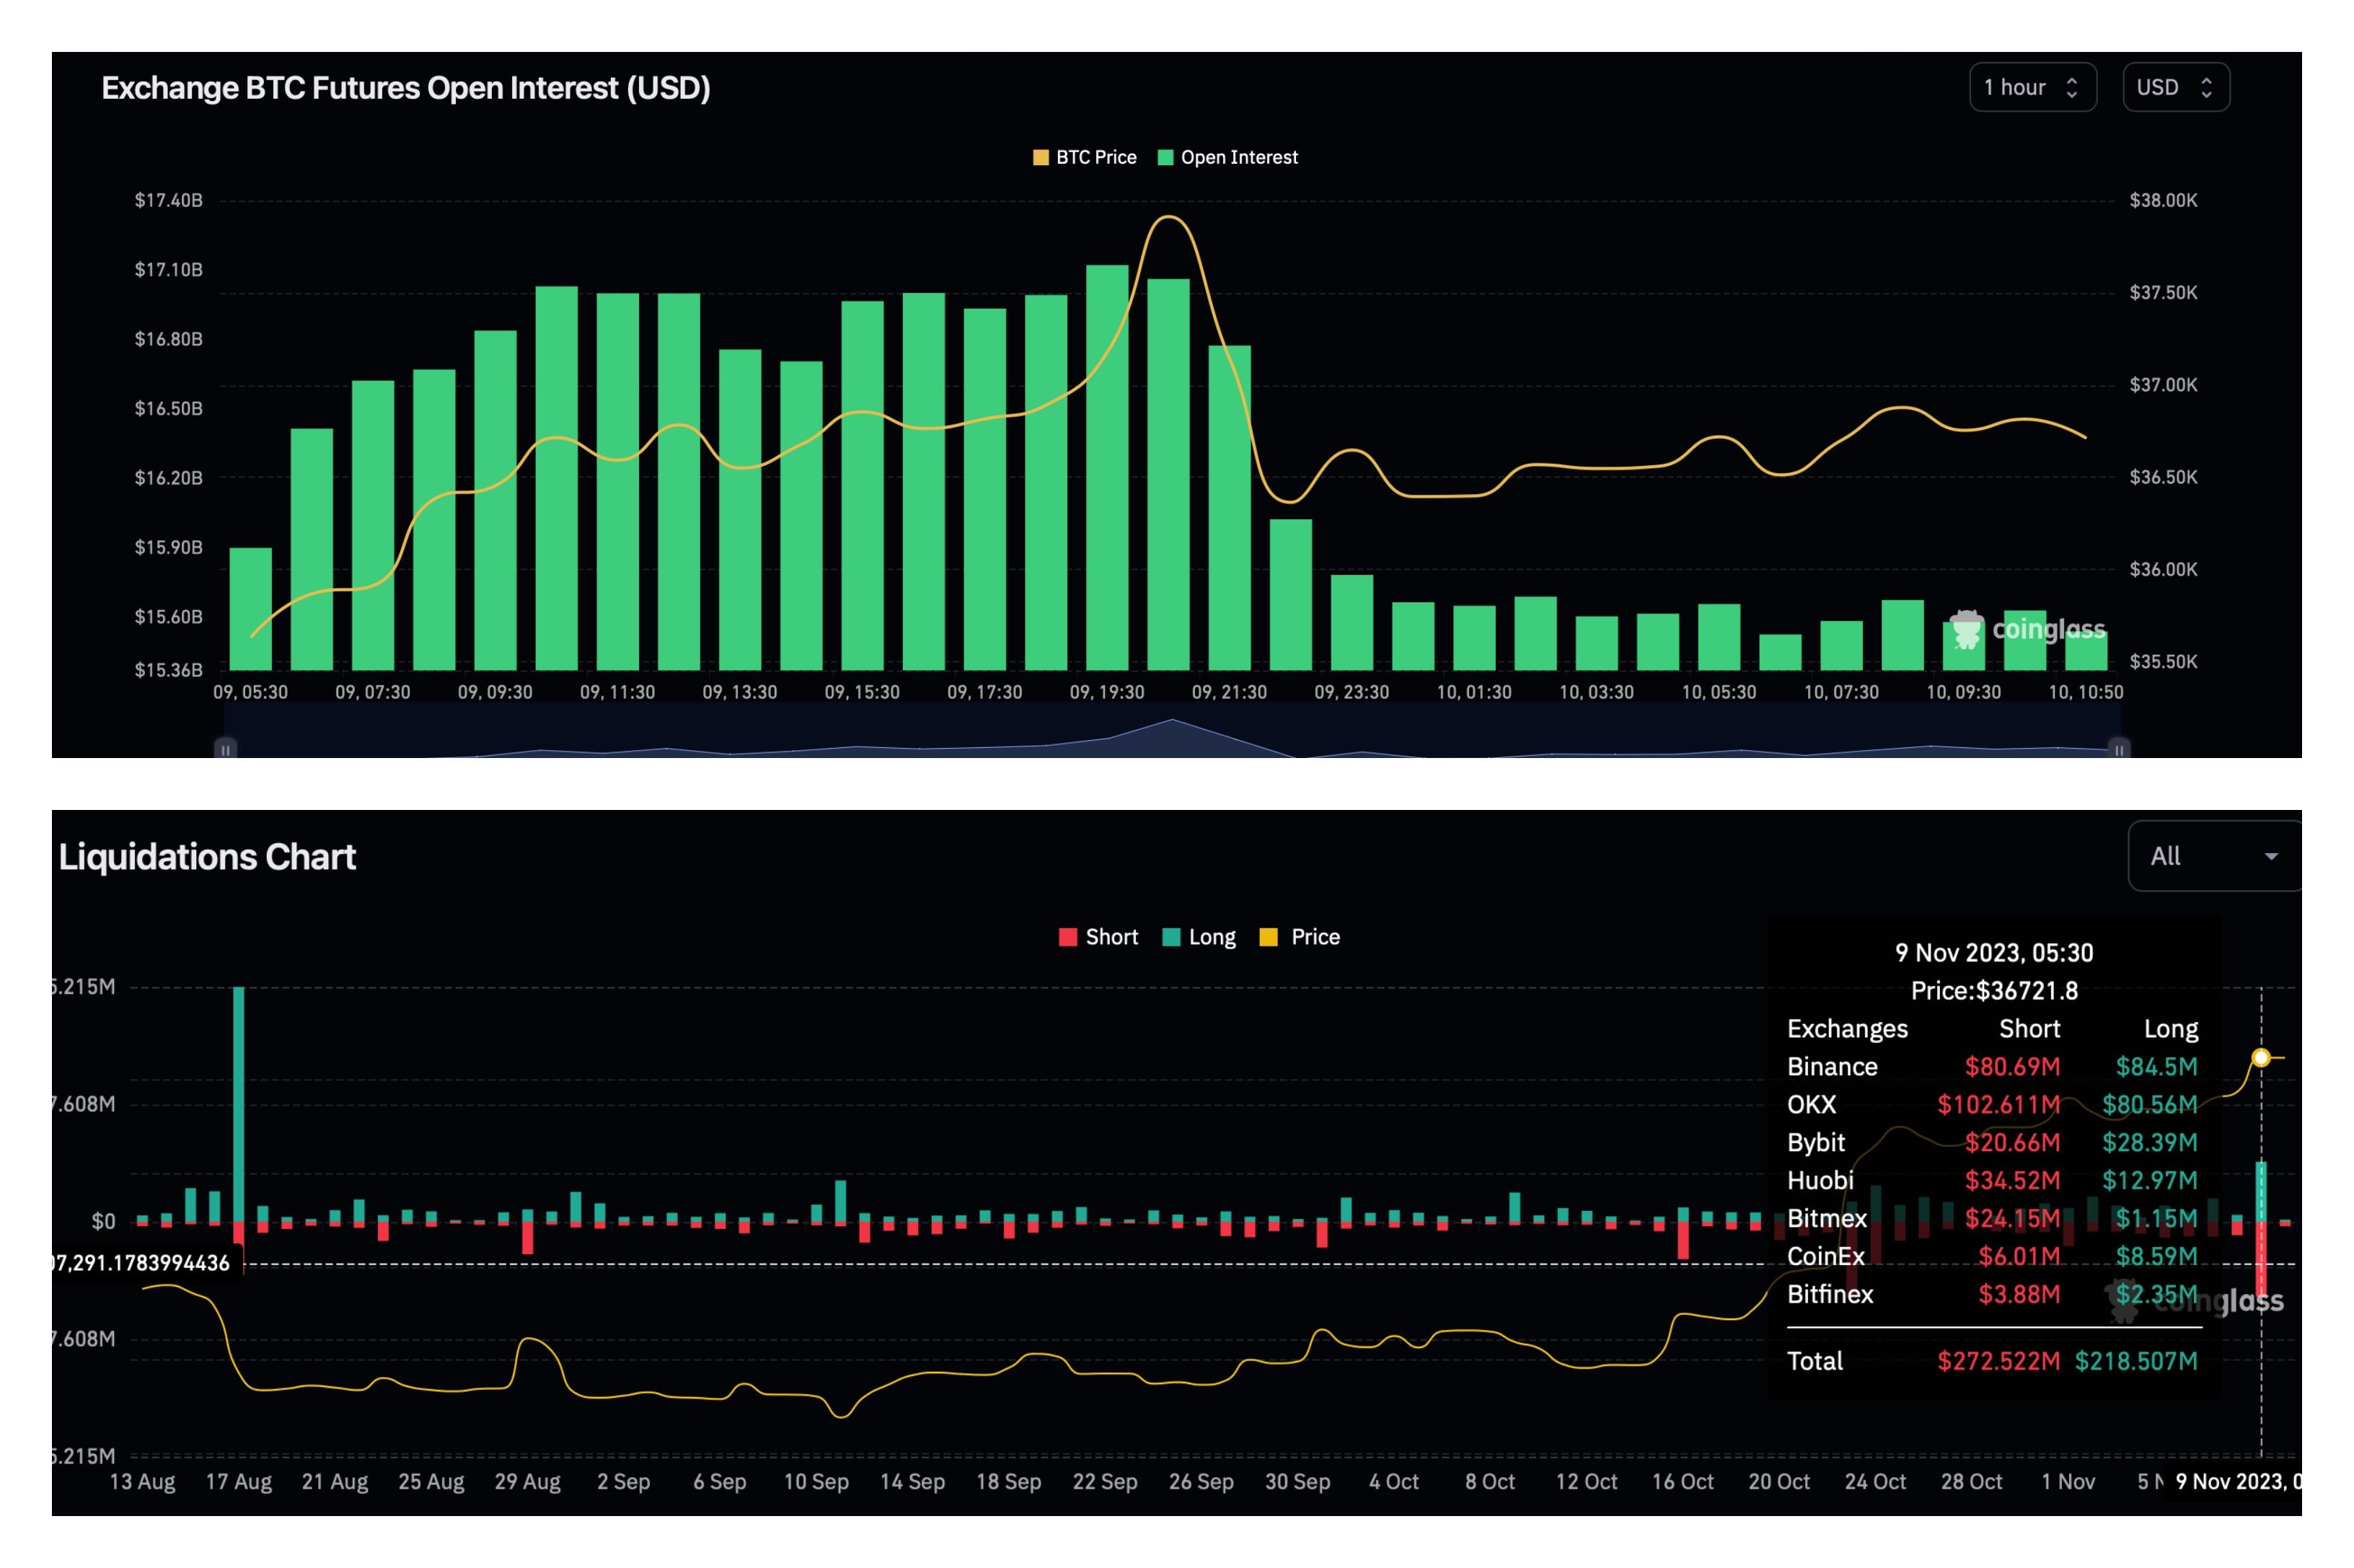
BTC OI, total crypto liquidations
Weekly BTC chart forecasts pause in uptrend
On the weekly chart, Bitcoin price has completed filling the Fair Value Gap (FVG), extending from $34,243 to $37,386. Interestingly, this gap is formed around the midpoint of the weekly bearish breaker that stretches from $28,805 to $41,330.
The Fair Value Gap is formed when there is a sudden movement of price in a single direction. The FVG is filled to provide a balanced price delivery.
The bearish breaker is a flipped demand zone with trapped bulls looking to exit. Hence, a retest of the demand zone from the underside is likely to trigger a selling spree. The same can be seen in the weekly chart where the first and the second retest of this weekly breaker in April and June resulted in nearly 20% corrections.
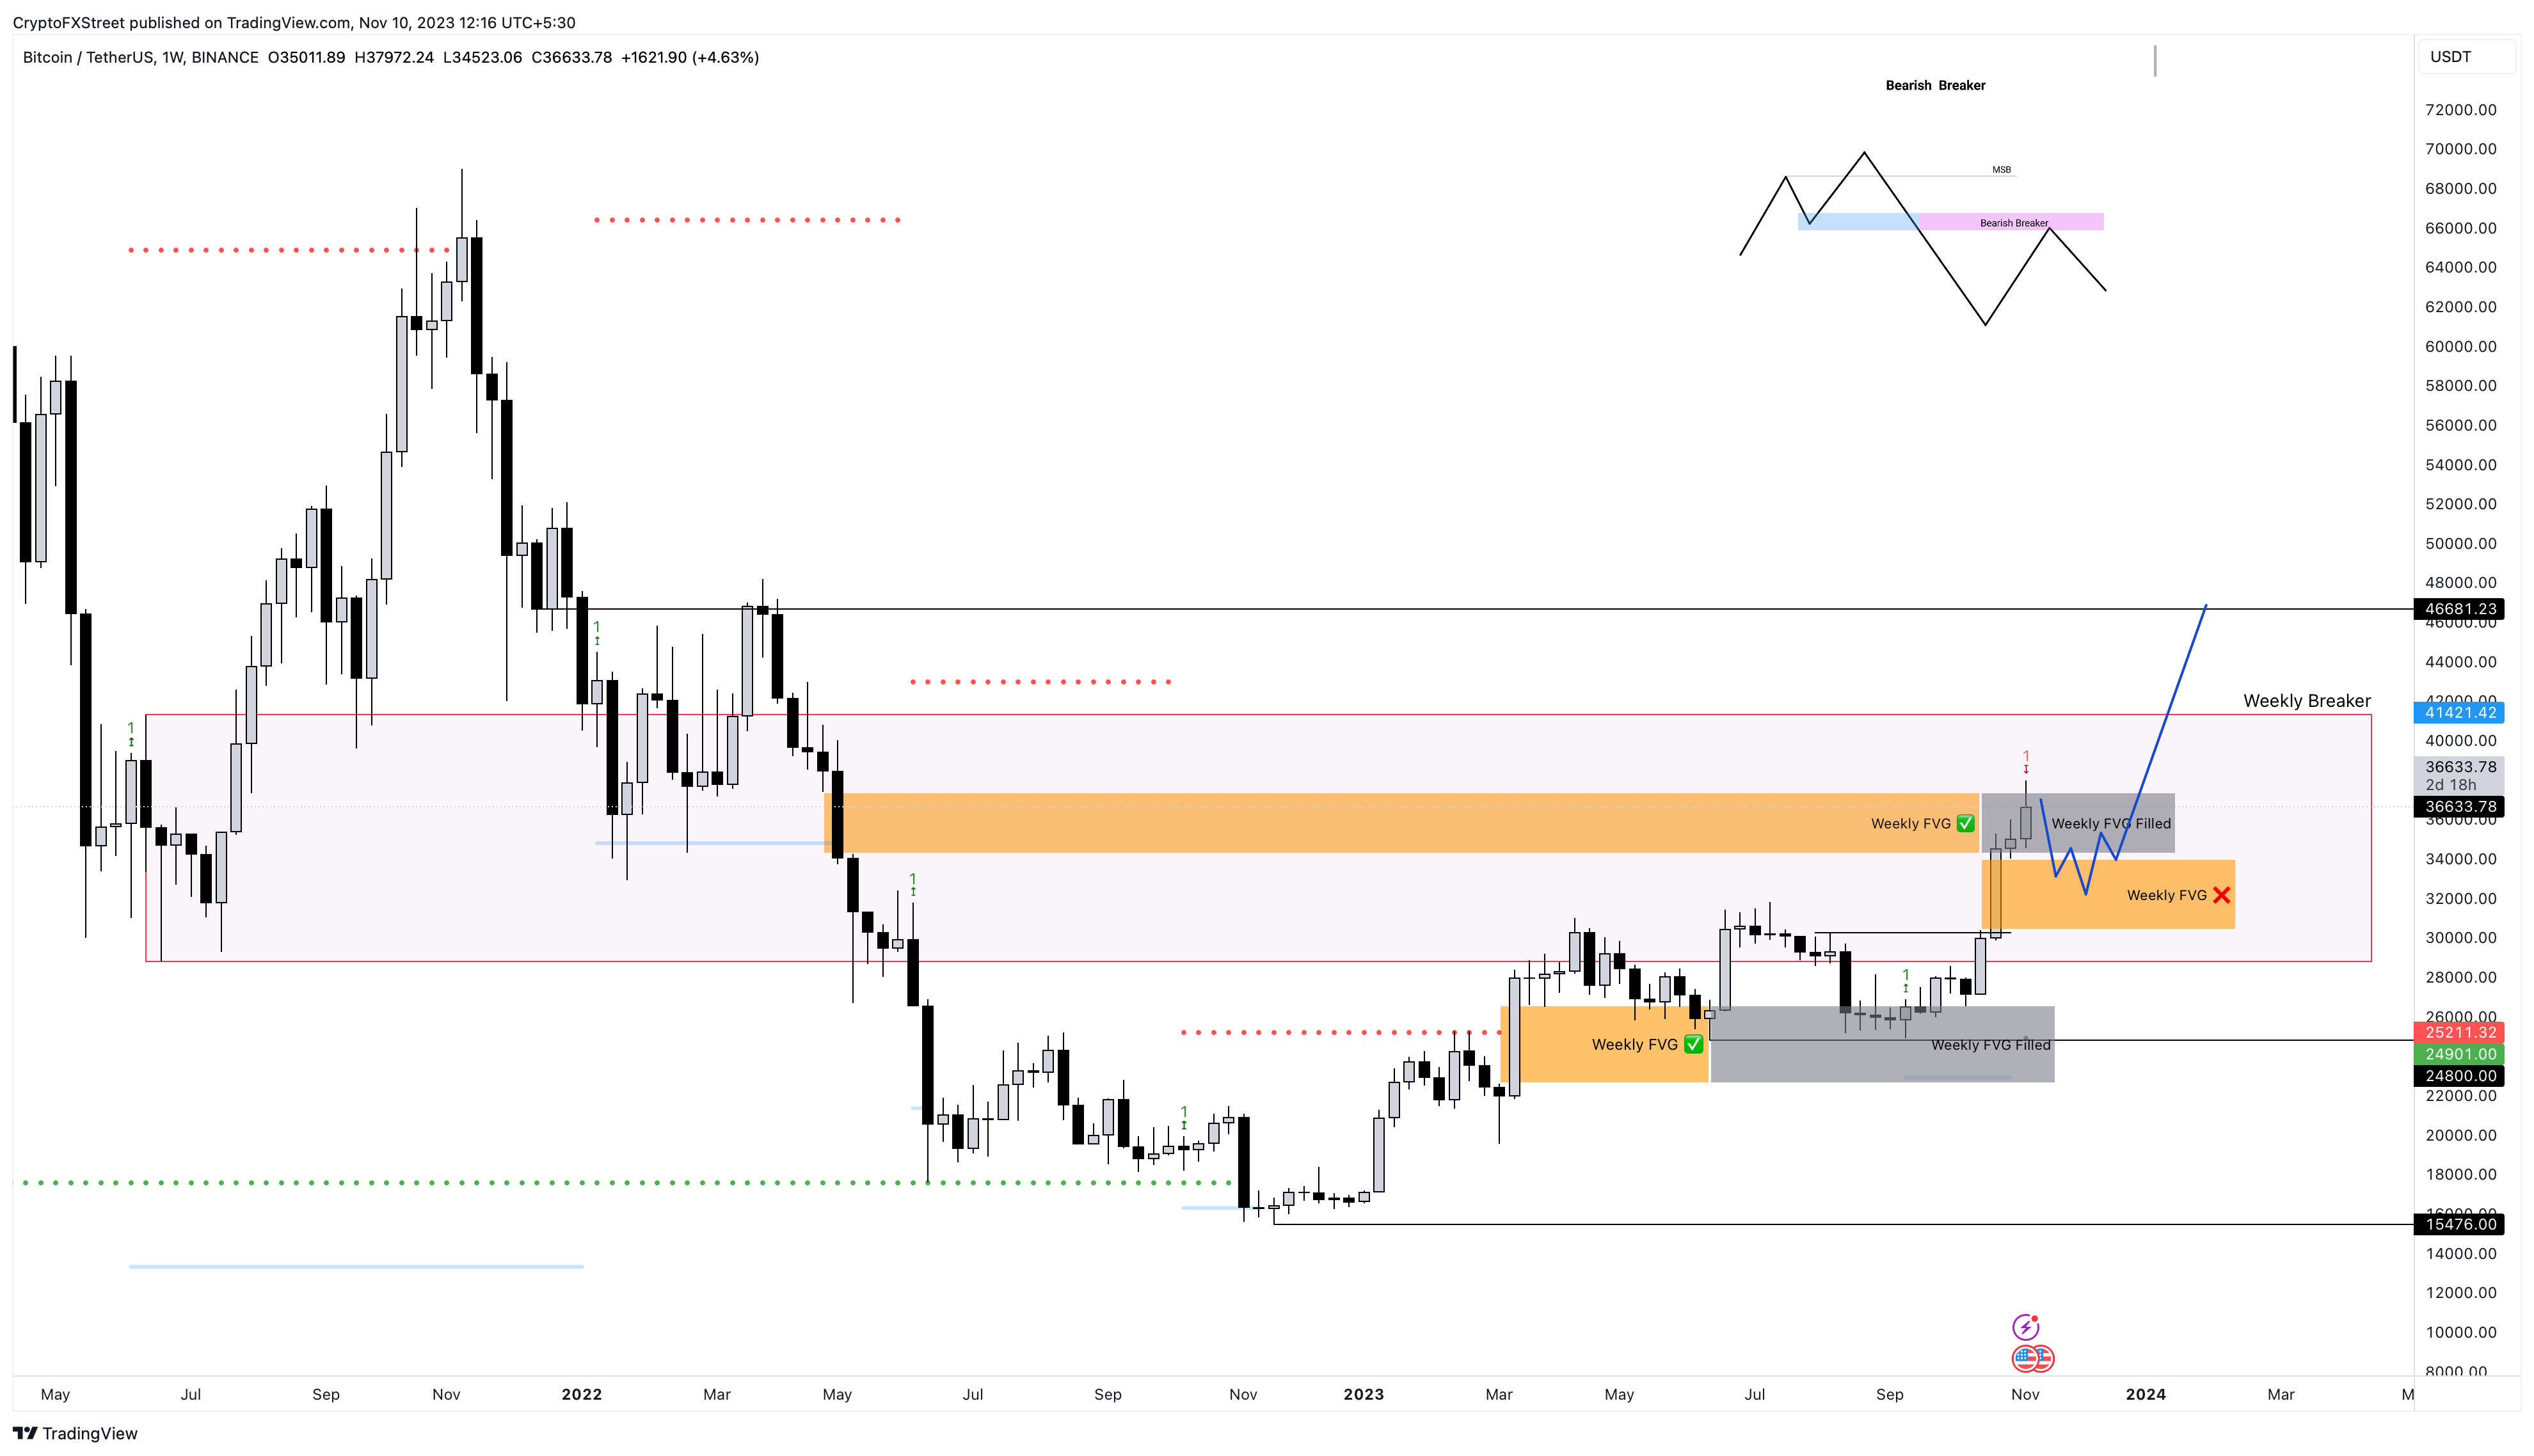
BTC/USDT 1-week chart
The ETF approval news has negated the weekly breaker’s selling pressure, which has pushed Bitcoin price up to $38,000. Although unlikely, if there is a lack of response from the SEC or delays in ETF approval, it could send BTC lower.
Adding credence to the potential pullback scenario is the Momentum Reversal Indicator (MRI), which has flashed a red “one” sell signal. This setup forecasts one-to-two down candlesticks.
After the COVID crash in March 2020, BTC rallied 174% from the $3,782 bottom and set up a local top at $10,380. The MRI produced a similar red “one” sell signal, which led to a 15% crash from the top and produced a higher low at $8,833. Following which, the uptrend resumed.
The current outlook for BTC looks similar. If history repeats, Bitcoin price could revisit $34,000. Interestingly, this level coincides with the newly created FVG, extending from $30,379 to $34.025.
A bounce in this area could be vital to kickstarting the next leg of the bull rally. In such a case, Bitcoin price could easily target the $40,000 psychological level. Beyond this hurdle lies $46,680, which is another key resistance barrier for BTC bulls to to tackle.
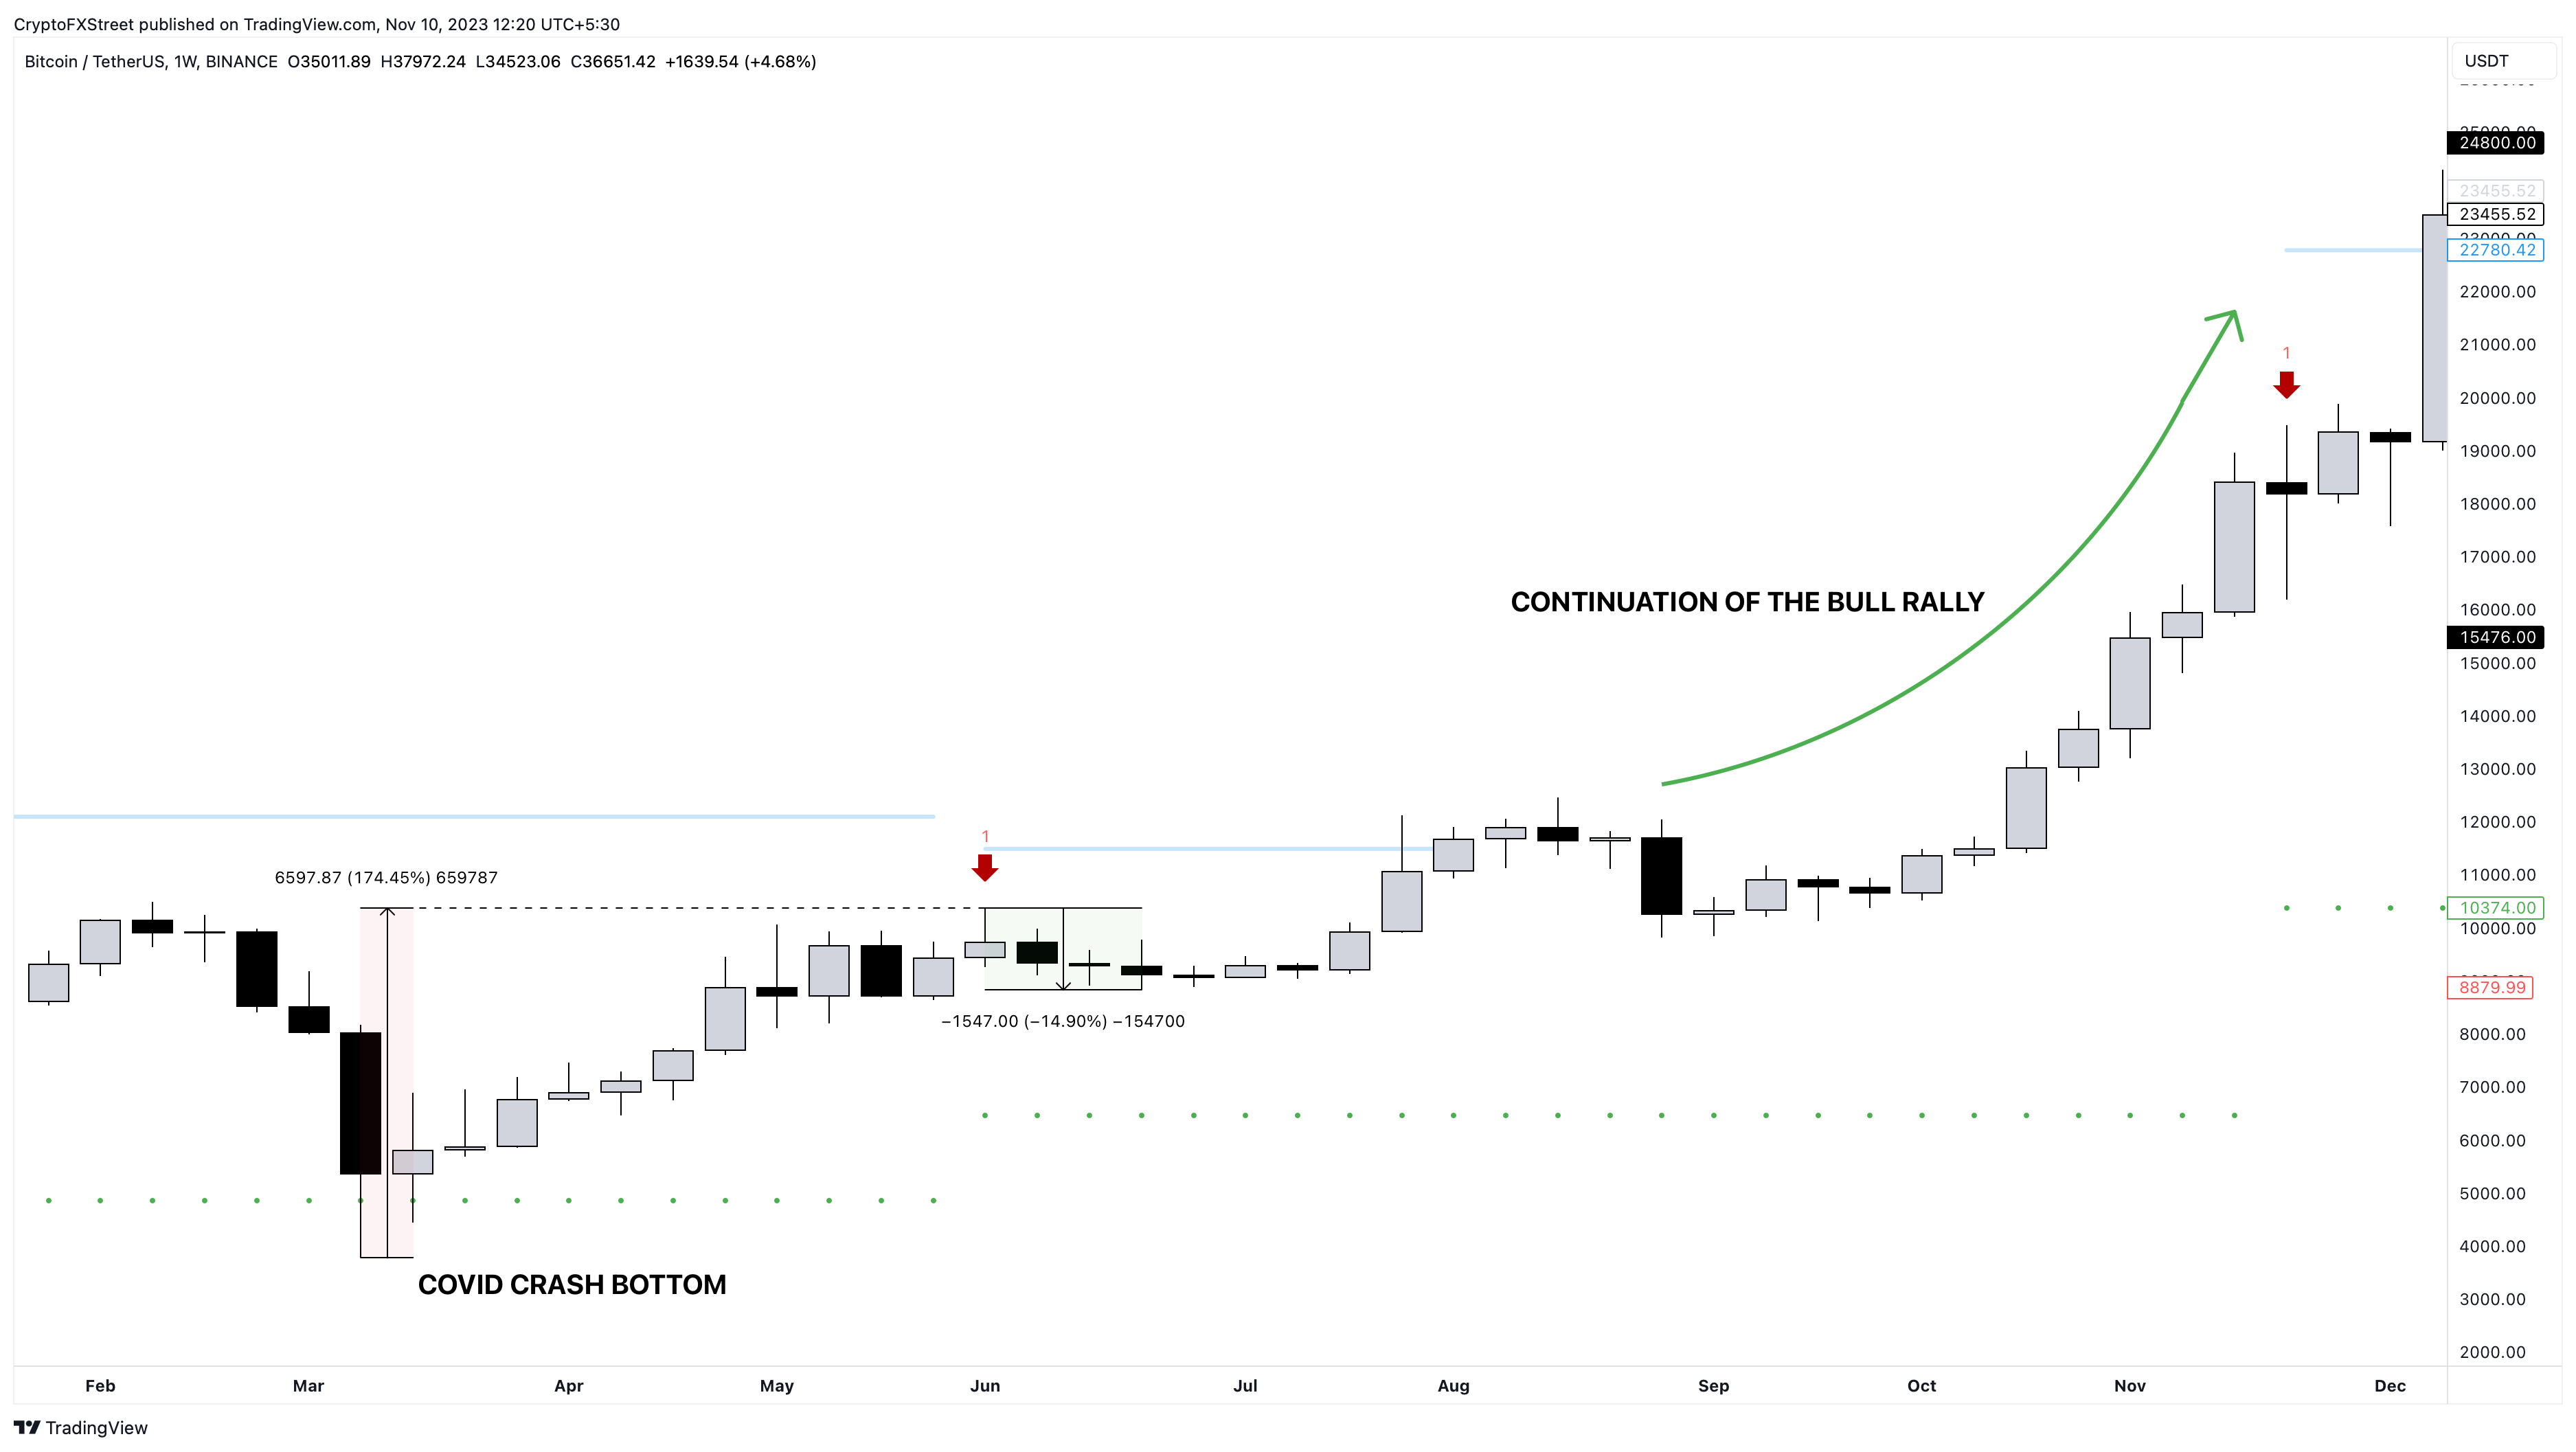
BTC/USDT 1-week chart
Daily BTC chart hints at impending correction
On the daily chart, Bitcoin price has set up three higher highs that are not confirmed by the Relative Strength Index (RSI). This non-conformity is termed as bearish divergence and often leads to a retracement in the underlying asset’s price.
The chances of triple divergence playing out will be higher if the upcoming daily candlestick closes are under $37,000. Assuming this outlook takes place, investors can expect BTC to target the sell-side liquidity (SSL) below the swing lows formed since October 27. This move should bring BTC down to around $34,000.
In a dire case scenario, where panic selling ensues, Bitcoin price could slide down into the daily FVG, extending from $30,229 to $32,833. As seen in the chart below, the weekly support level at $31,767 is a good confluence for buying dips.
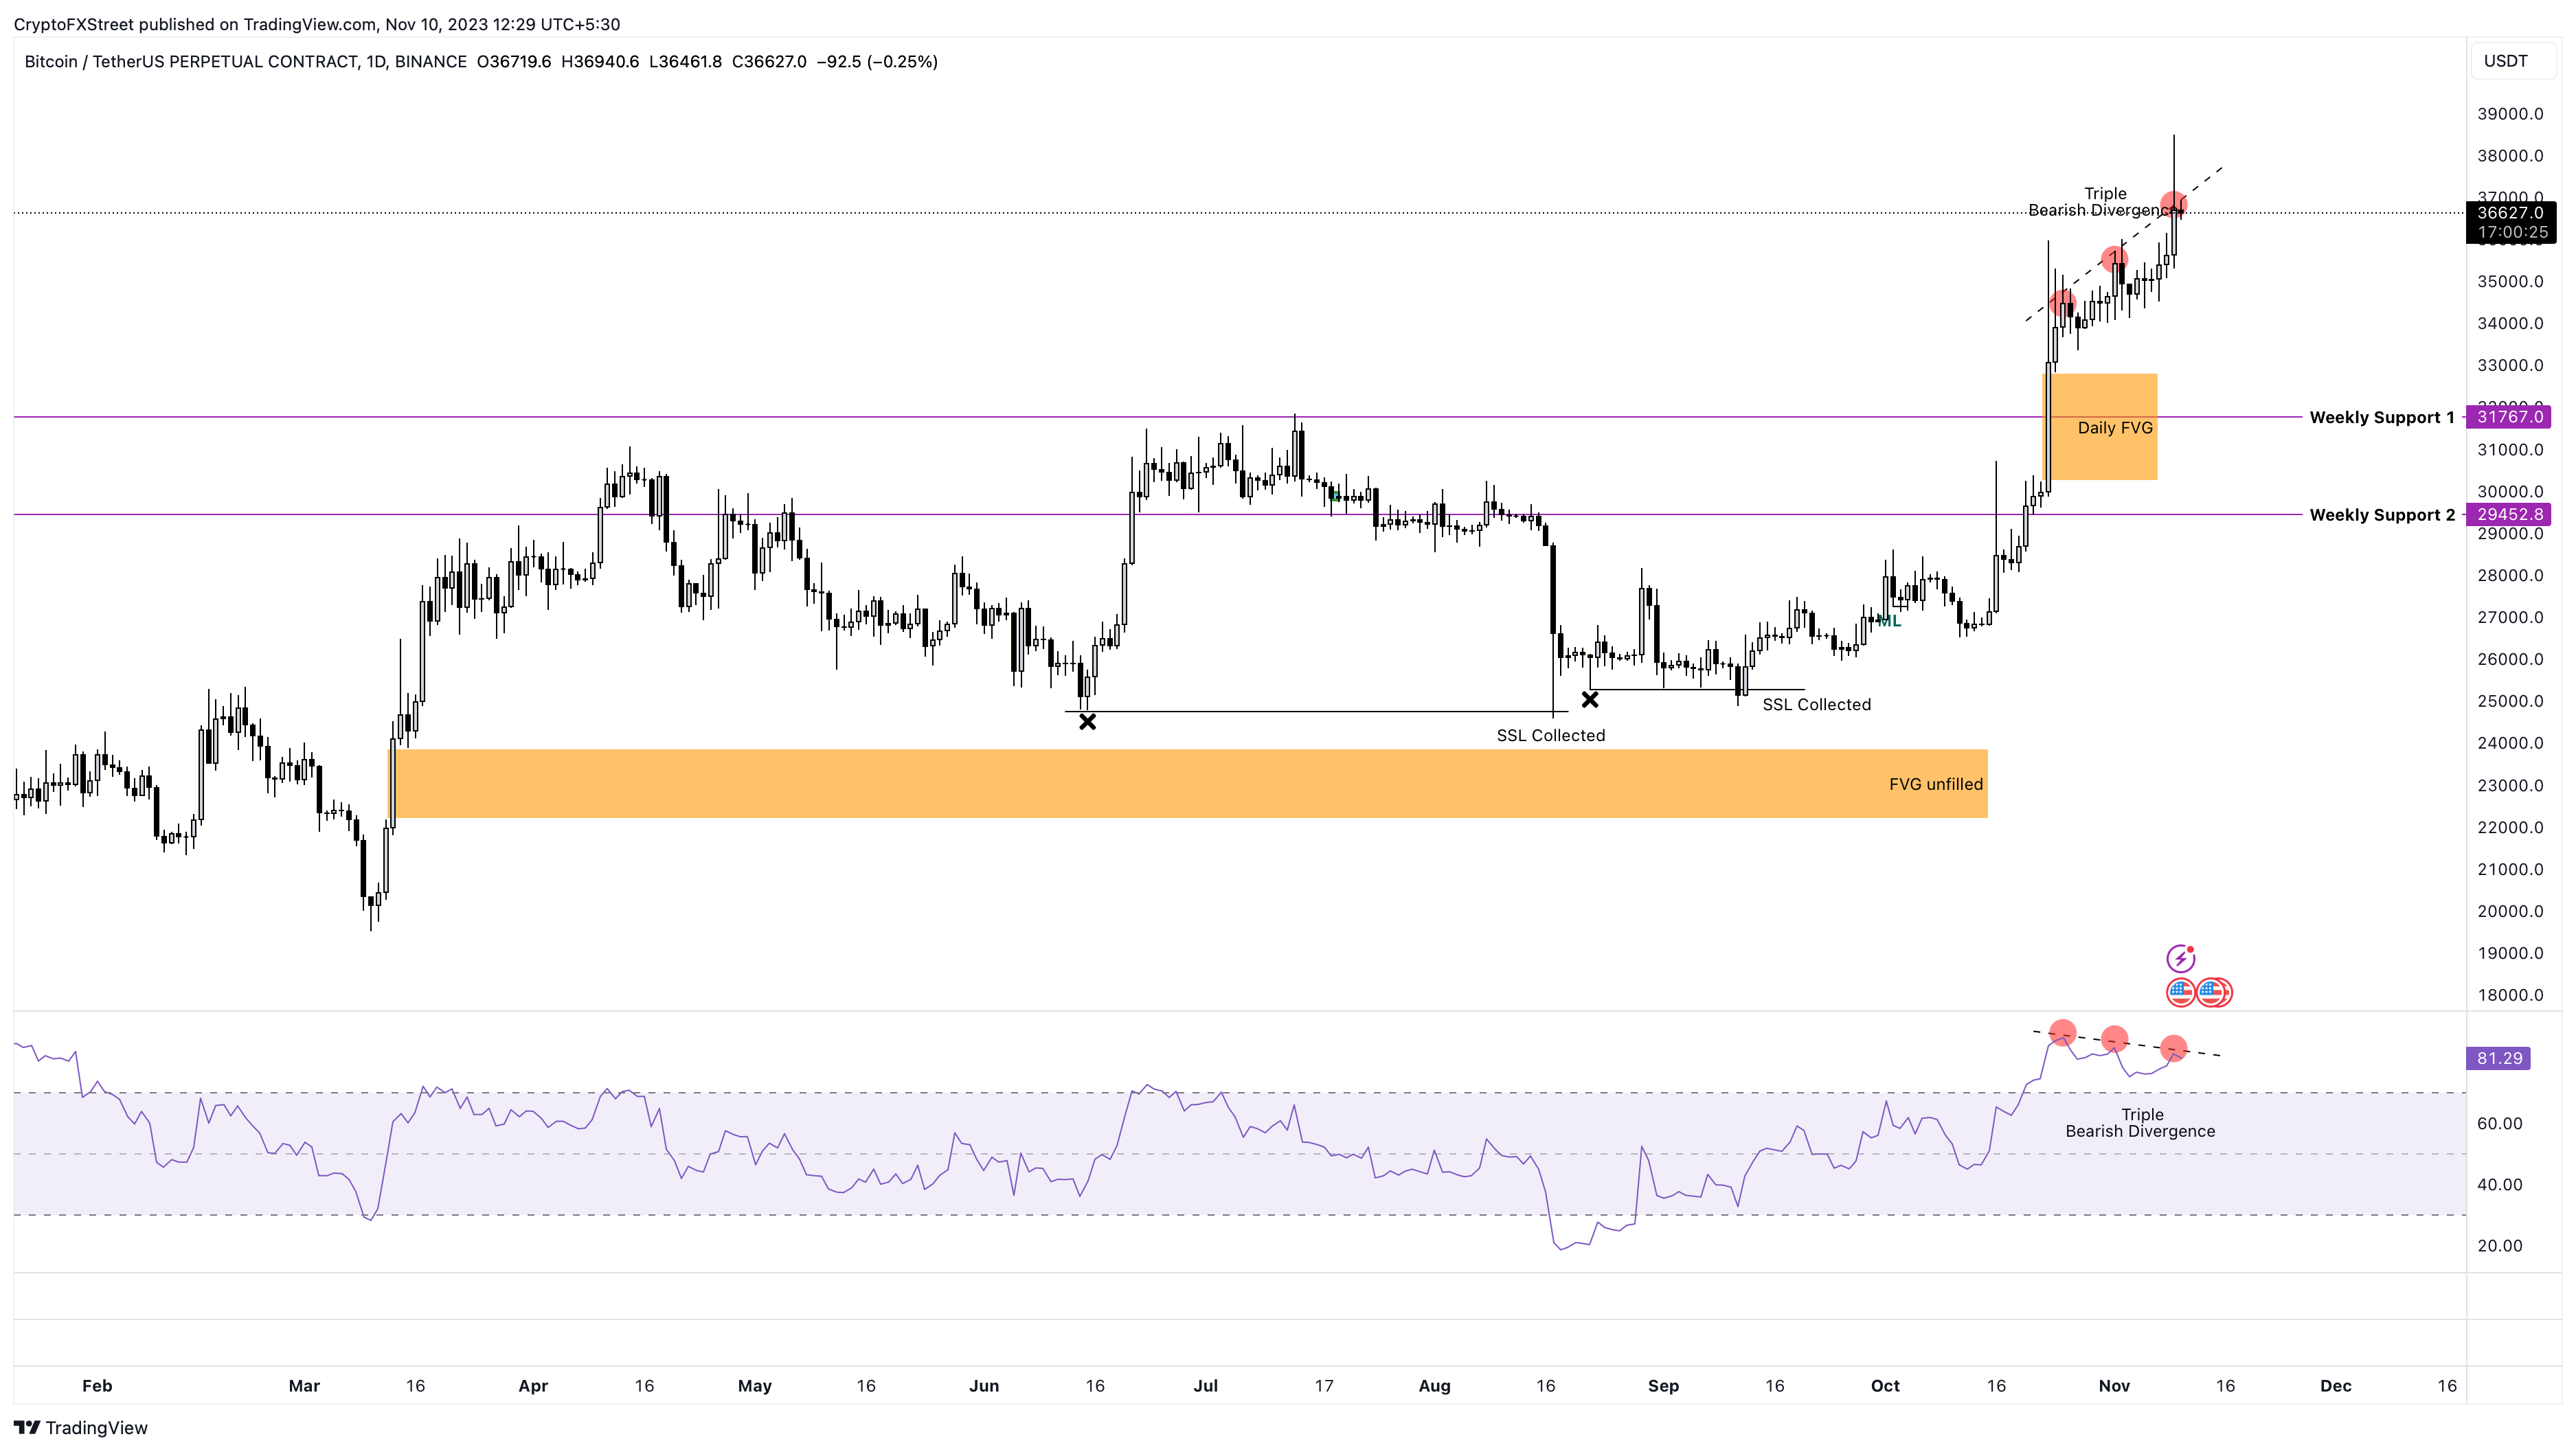
BTC/USDT 1-day chart
Invalidation scenarios
The following are invalidation scenarios that would sidestep the short-term sell signal and lead straight to a continuation of the uptrend:
- The US SEC approves all 12 filed ETF applications in the ETF window described above: This scenario will not only push BTC past the $38,000 hurdle, but also propel it to $45,000 or higher. Such a scenario would even have enough FOMO to push BTC to a level where it contests 2021 highs of $60,000.
- A daily candlestick close above $38,000 invalidates the bearish divergence sell signal: This outlook will alleviate the short-term sell signal and lead to one of two things – a sideways movement or a slow climb up, until the news flow regarding ETFs drops.
Author

Akash Girimath
FXStreet
Akash Girimath is a Mechanical Engineer interested in the chaos of the financial markets. Trying to make sense of this convoluted yet fascinating space, he switched his engineering job to become a crypto reporter and analyst.


