Which coins can keep the rise going after a slight correction?

On the last day of the week, bulls could not hold the initiative as most of the coins are again in the red zone.
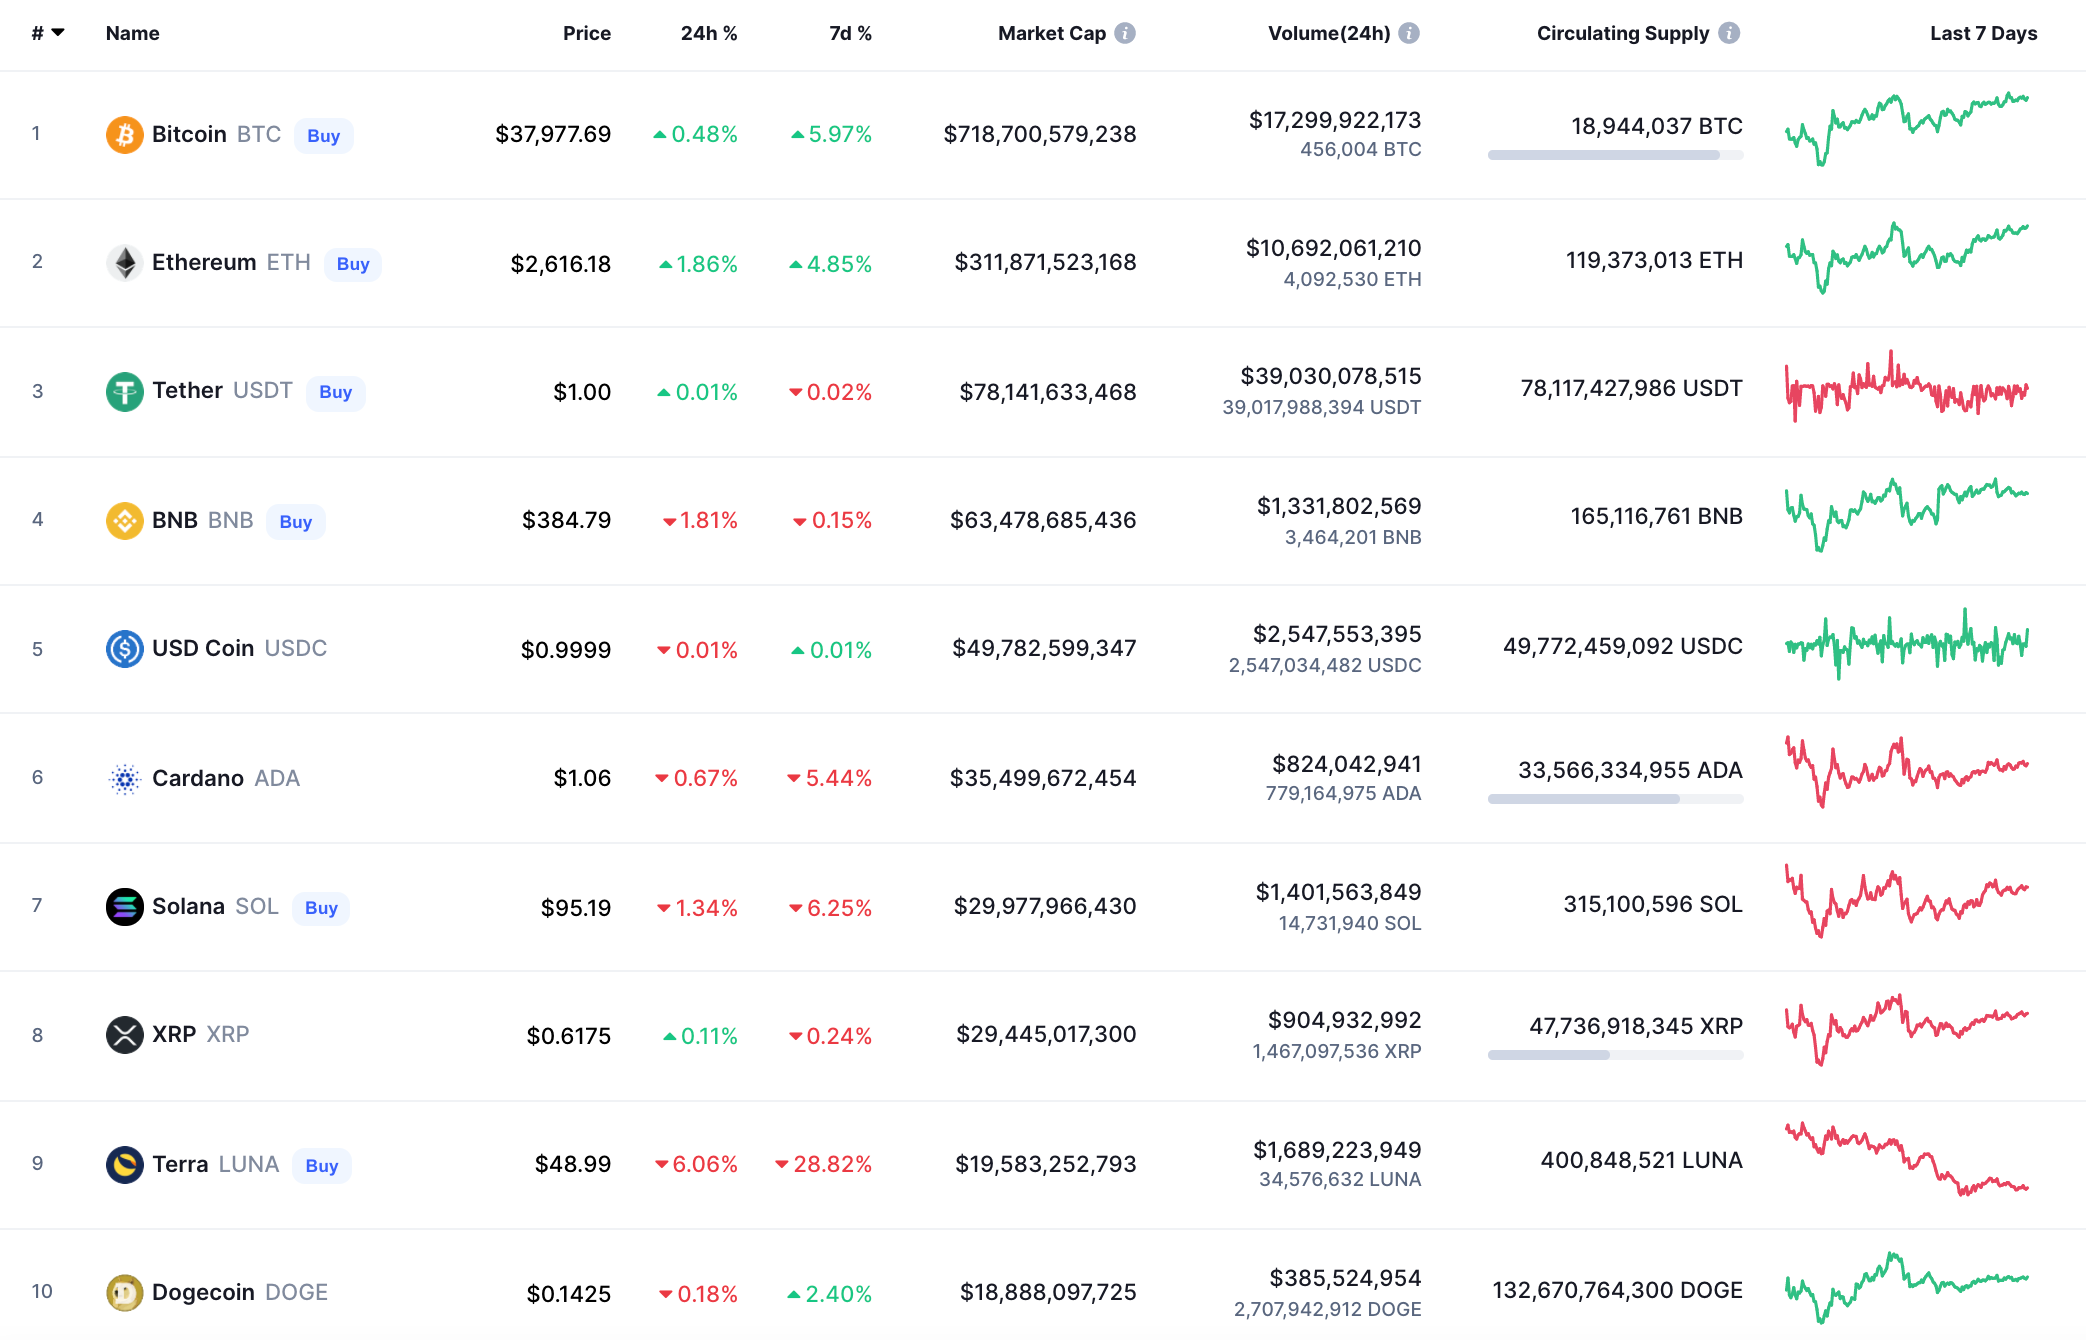
Top coins by CoinMarketCap
BTC/USD
While altcoins are going down, the rate of Bitcoin (BTC) has increased by 0.48% since yesterday.
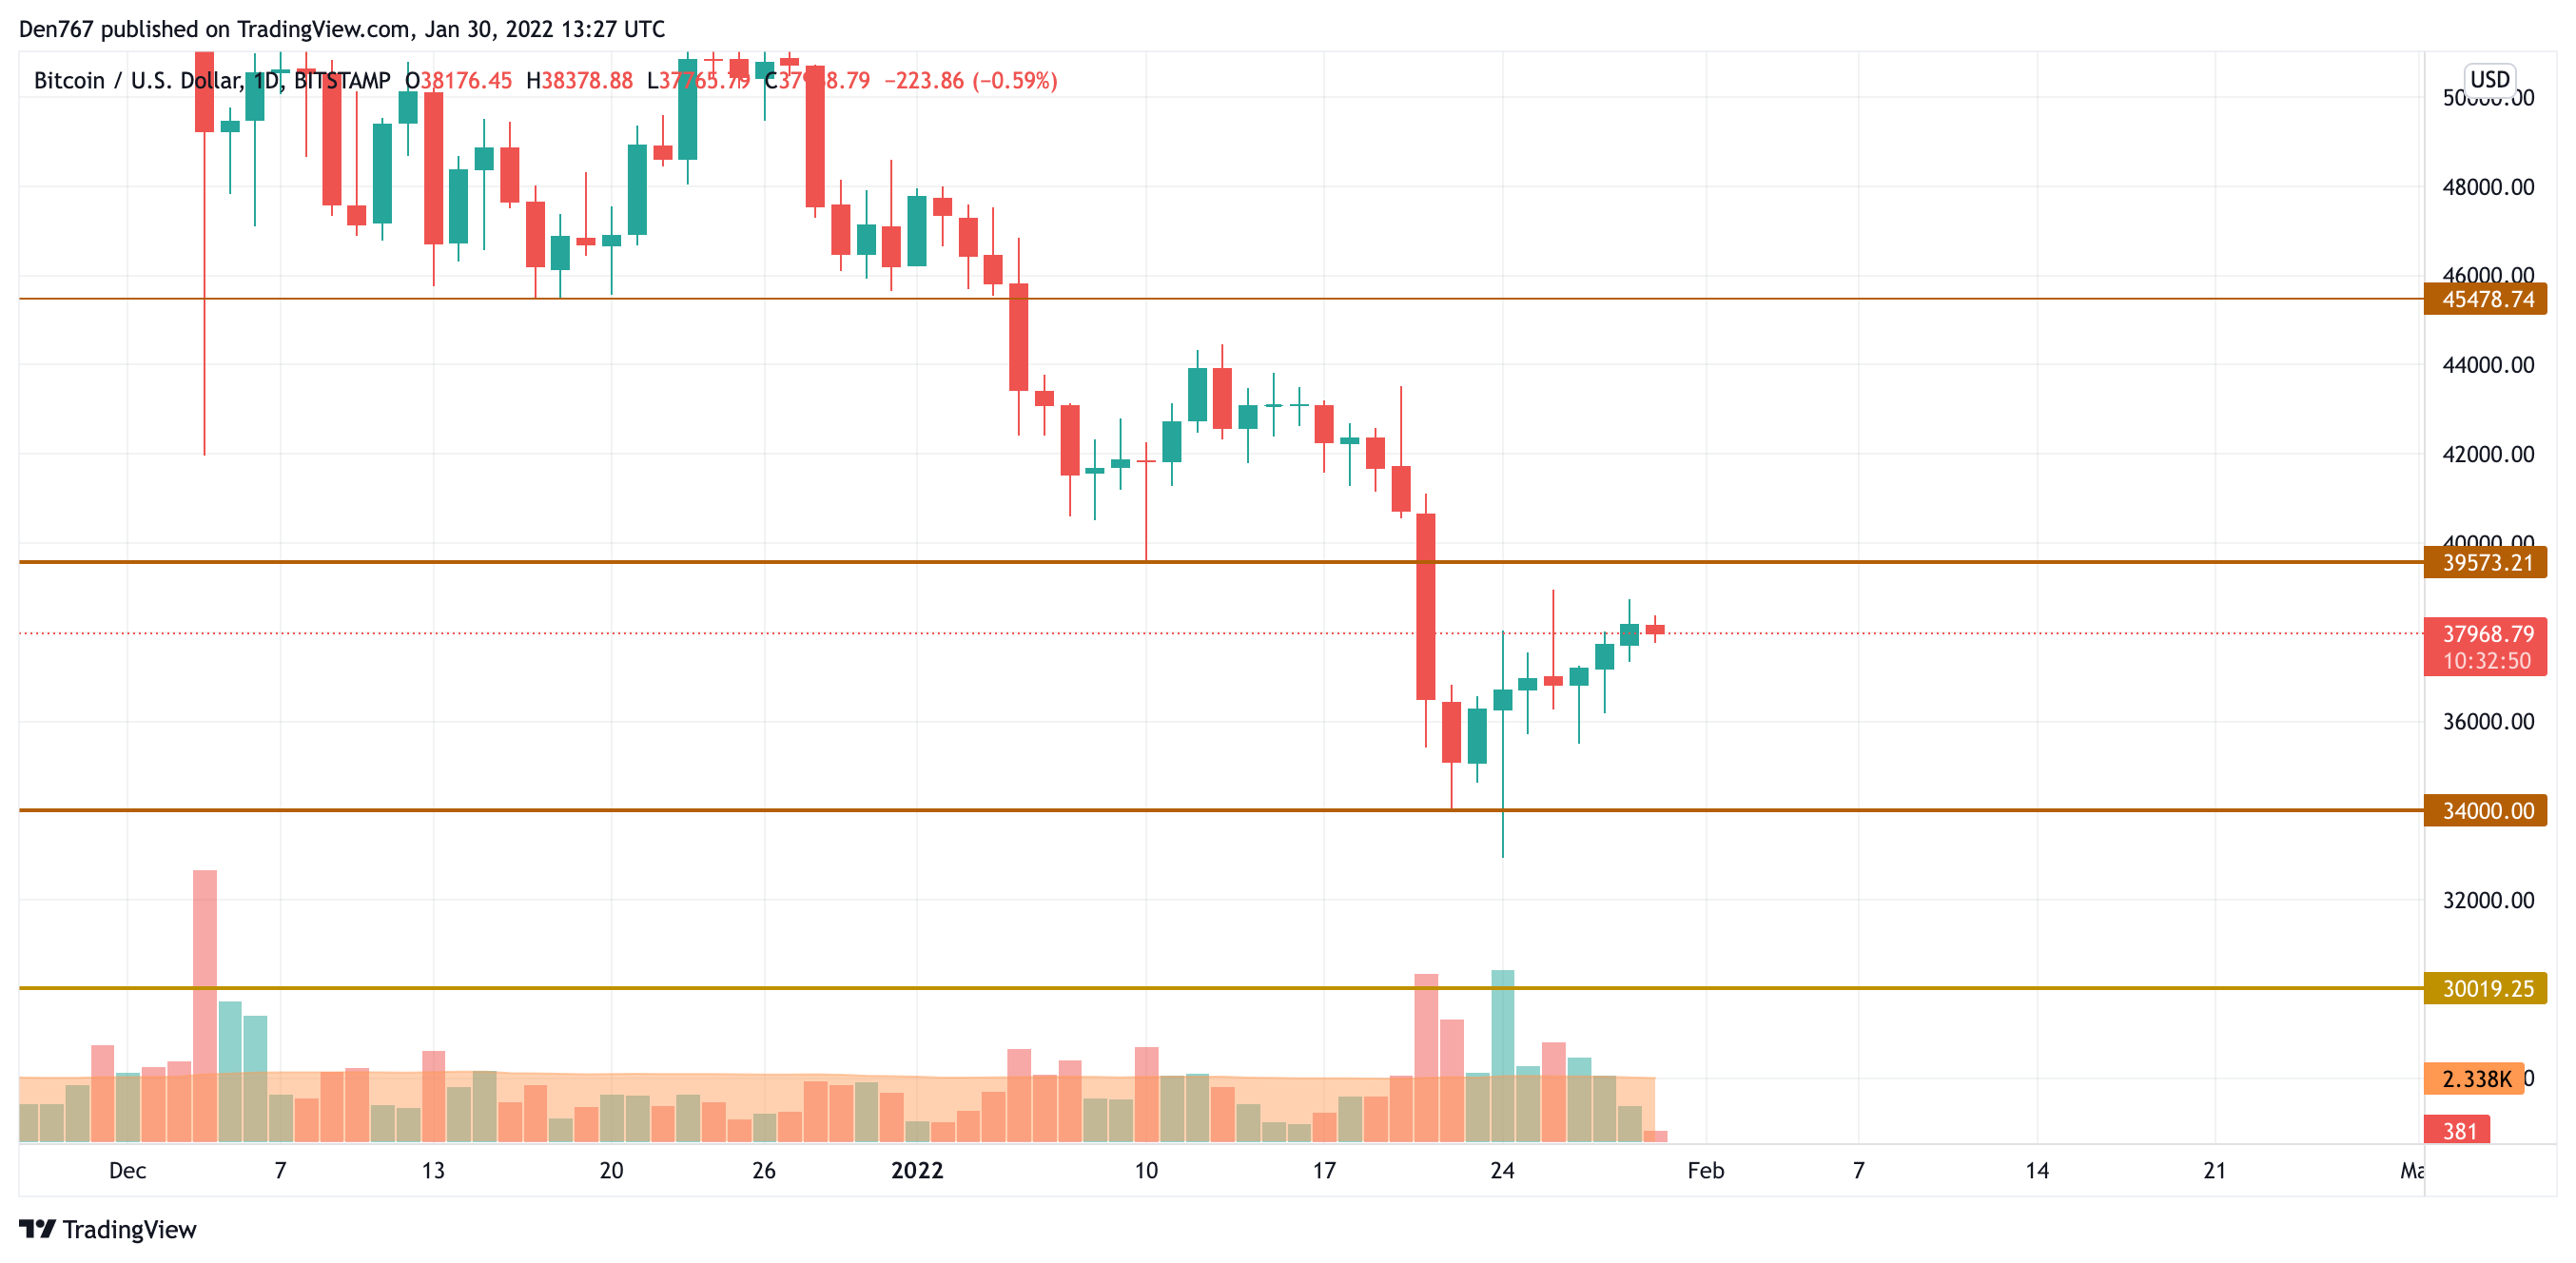
BTC/USD chart by TradingView
On the daily chart, Bitcoin (BTC) is coming closer to the resistance level at $39,573. If buyers can break it and fix above, the correction can be transformed to mid-term growth. Such a price action is relevant until mid-February.
Bitcoin is trading at $37,997 at press time.
SOL/USD
Solana (SOL) could not follow the rise of Bitcoin (BTC), going down by 2.12%.
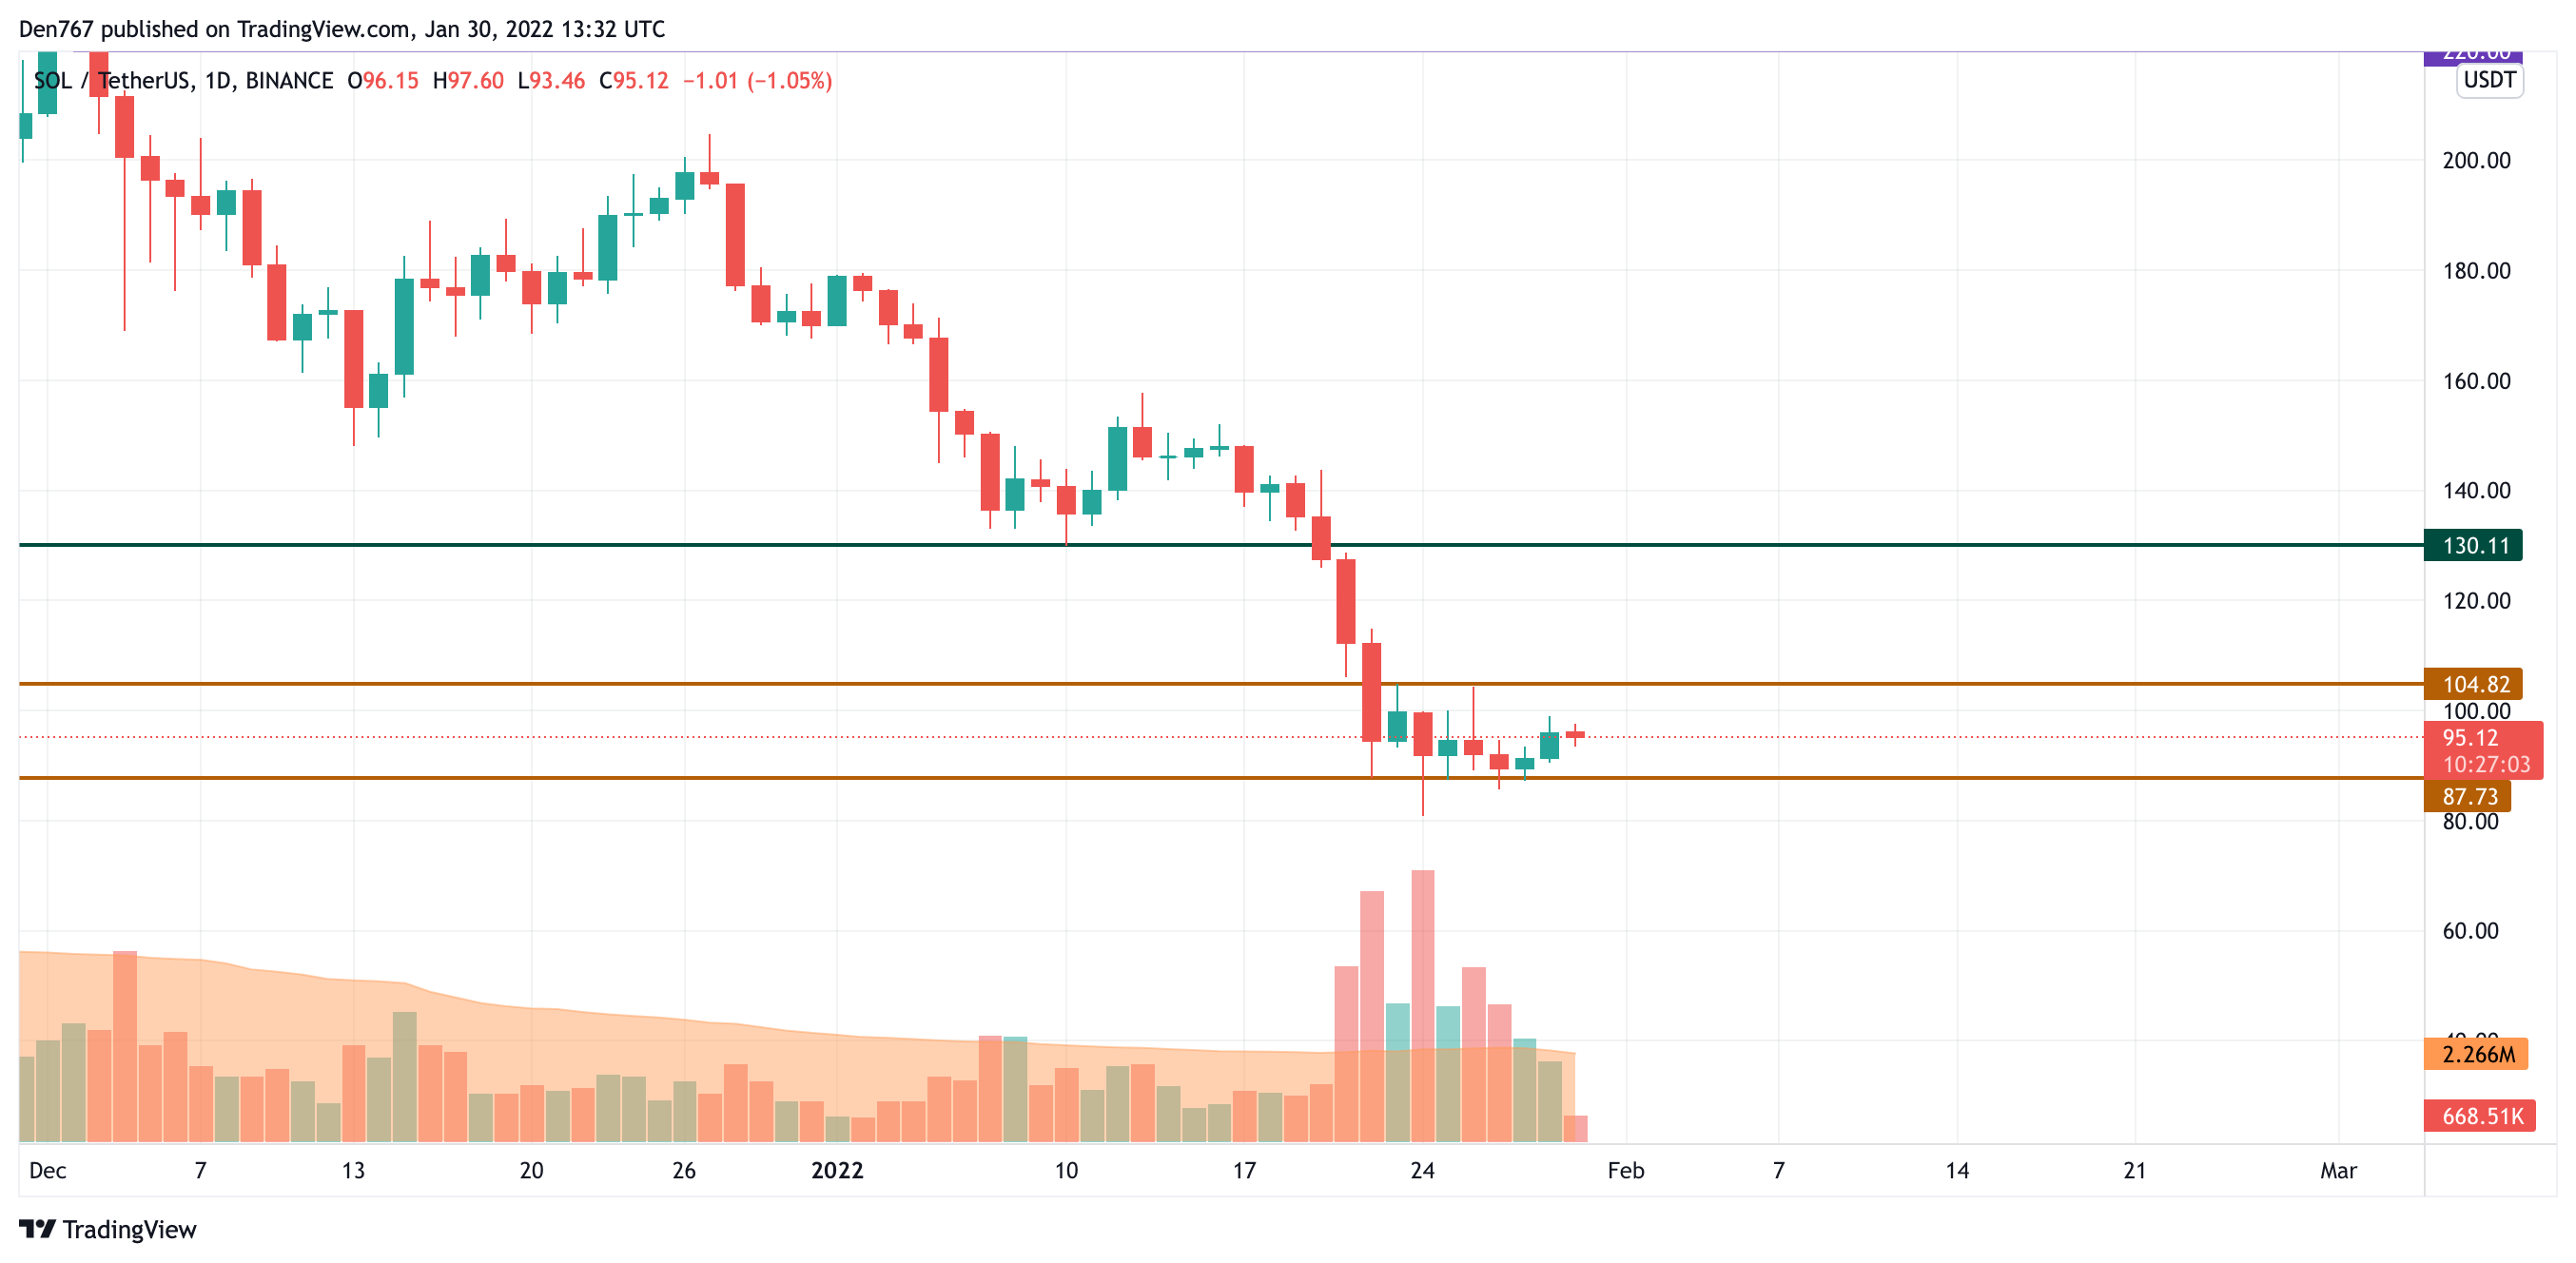
SOL/USD chart by TradingView
After SOL bounced off the support level at $87.73, the price keeps trading sideways, accumulating power for a further sharp move.
In this case, one needs to pay close attention to the level at $104.82—the potential breakout of which might be a prerequisite for continued growth.
SOL is trading at $94.83 at press time.
LUNA/USD
LUNA is the biggest loser from the list, going down by 7.43%.
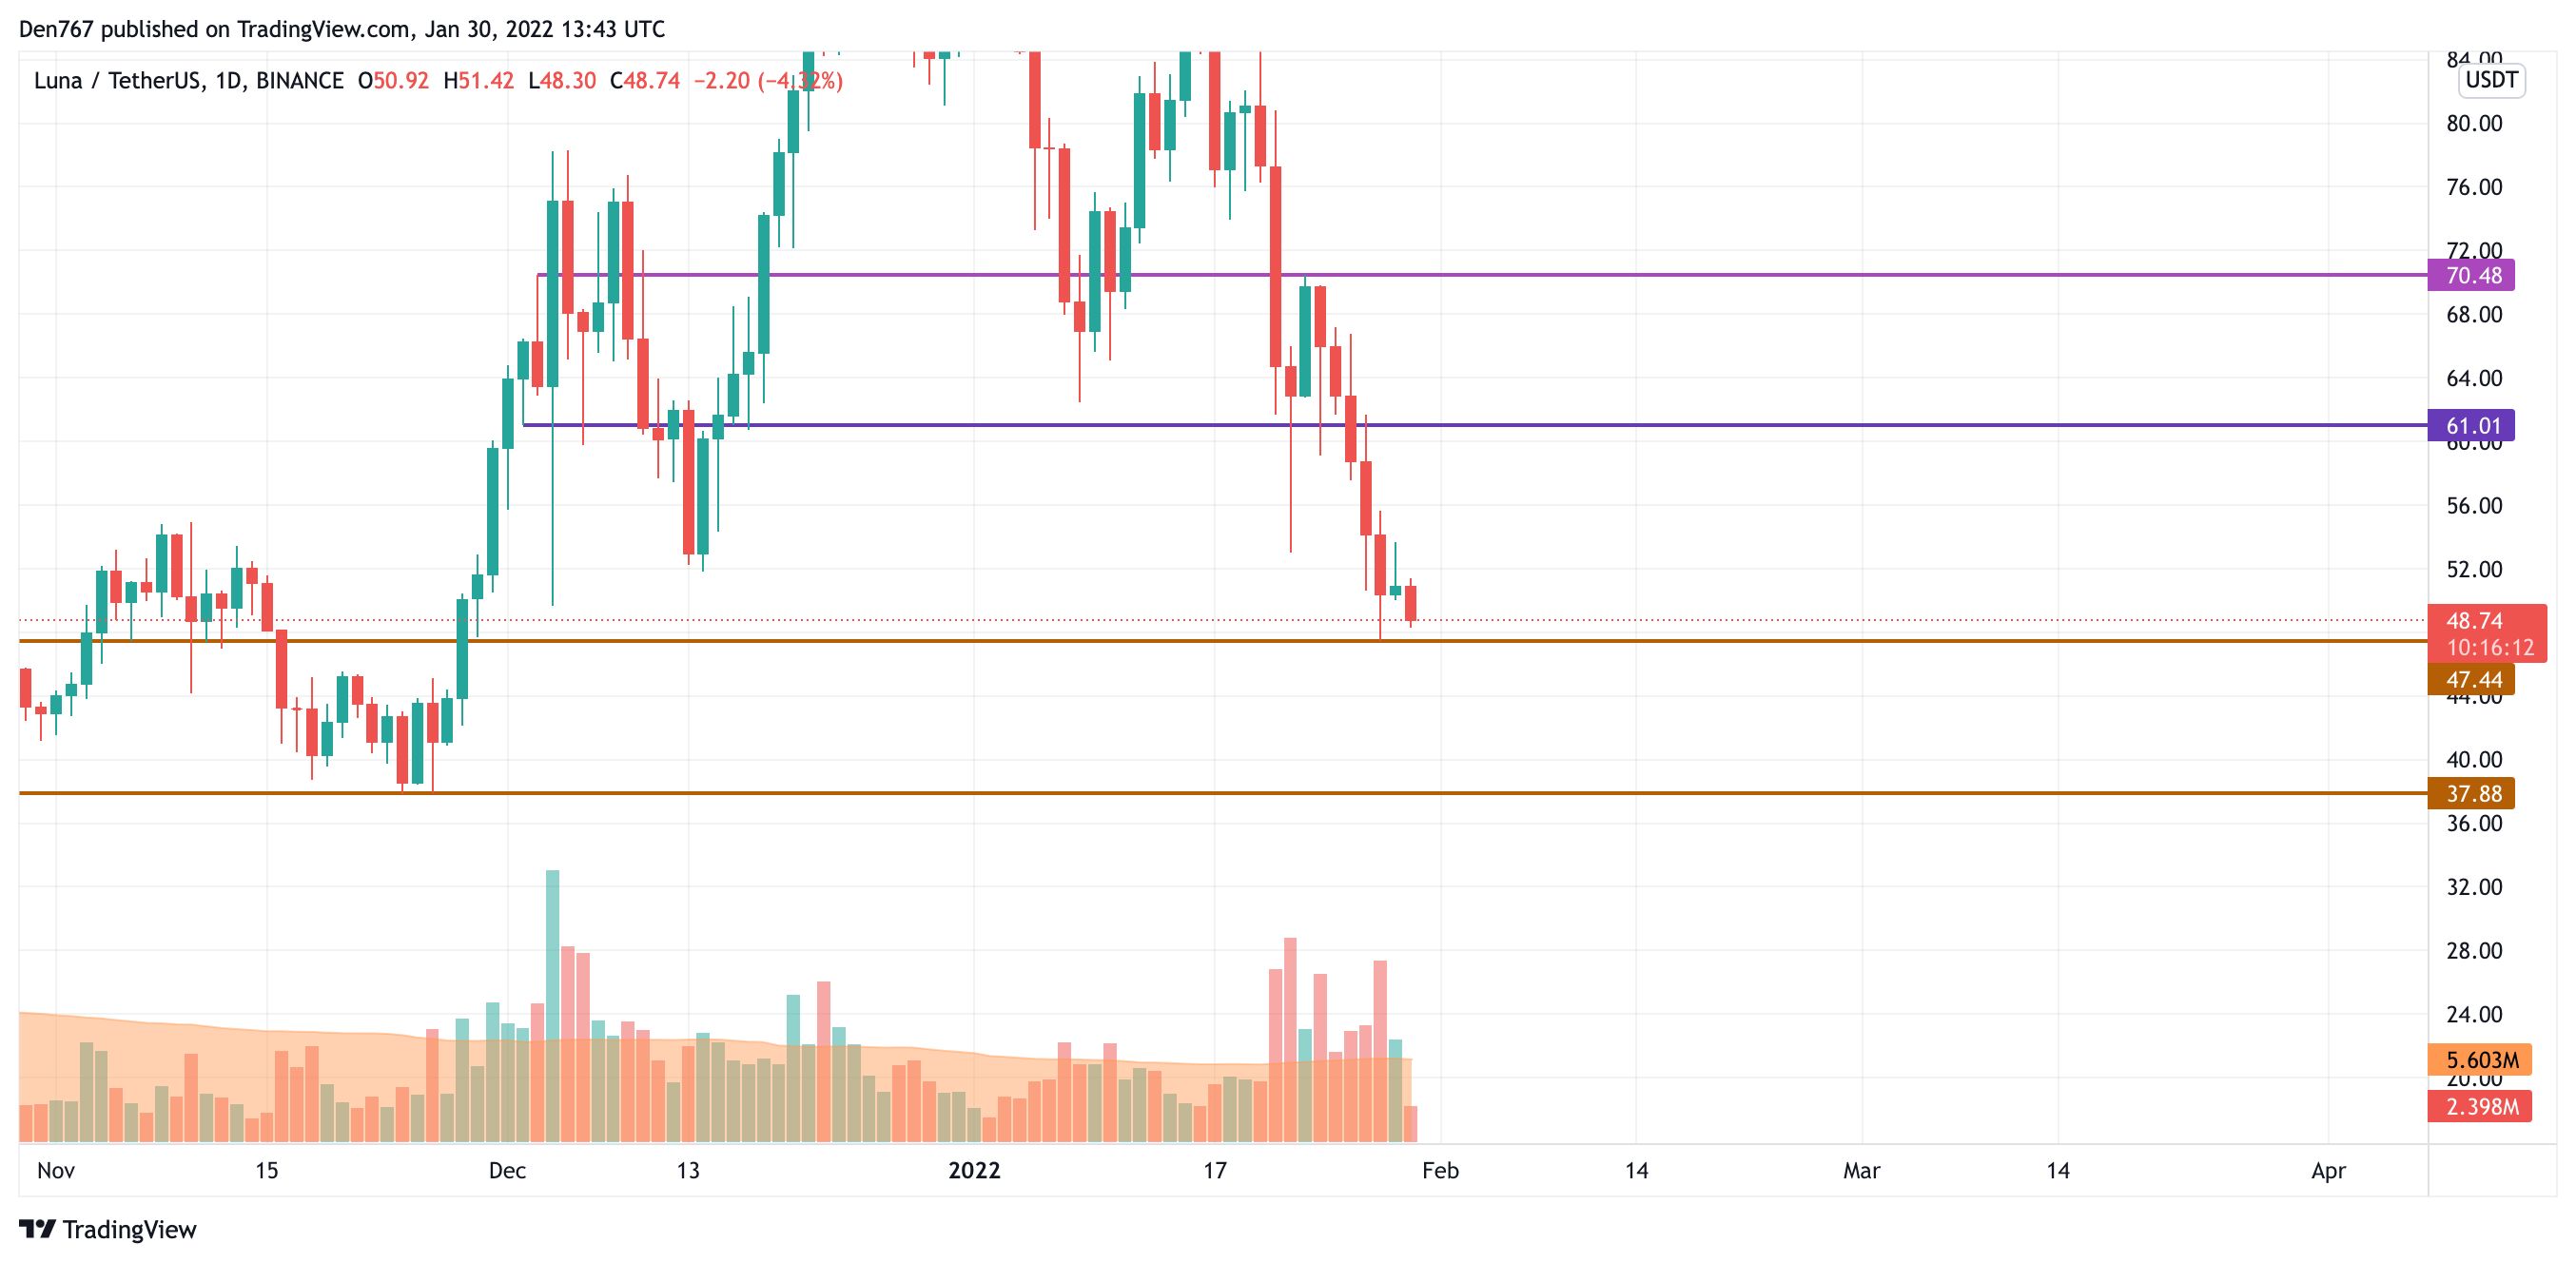
LUNA/USD chart by TradingView
LUNA is looking much worse compared to other altcoins. The price is coming back to the recently tested support level at $47.44 on the daily timeframe. If bears manage to break it, the fall may continue to the next level at $37.88 within the next few days.
LUNA is trading at $48.74 at press time.
DOGE/USD
The rate of DOGE is almost unchanged since yesterday, with a fall accounting for only 0.53%.
DOGE/USD chart by Trading View
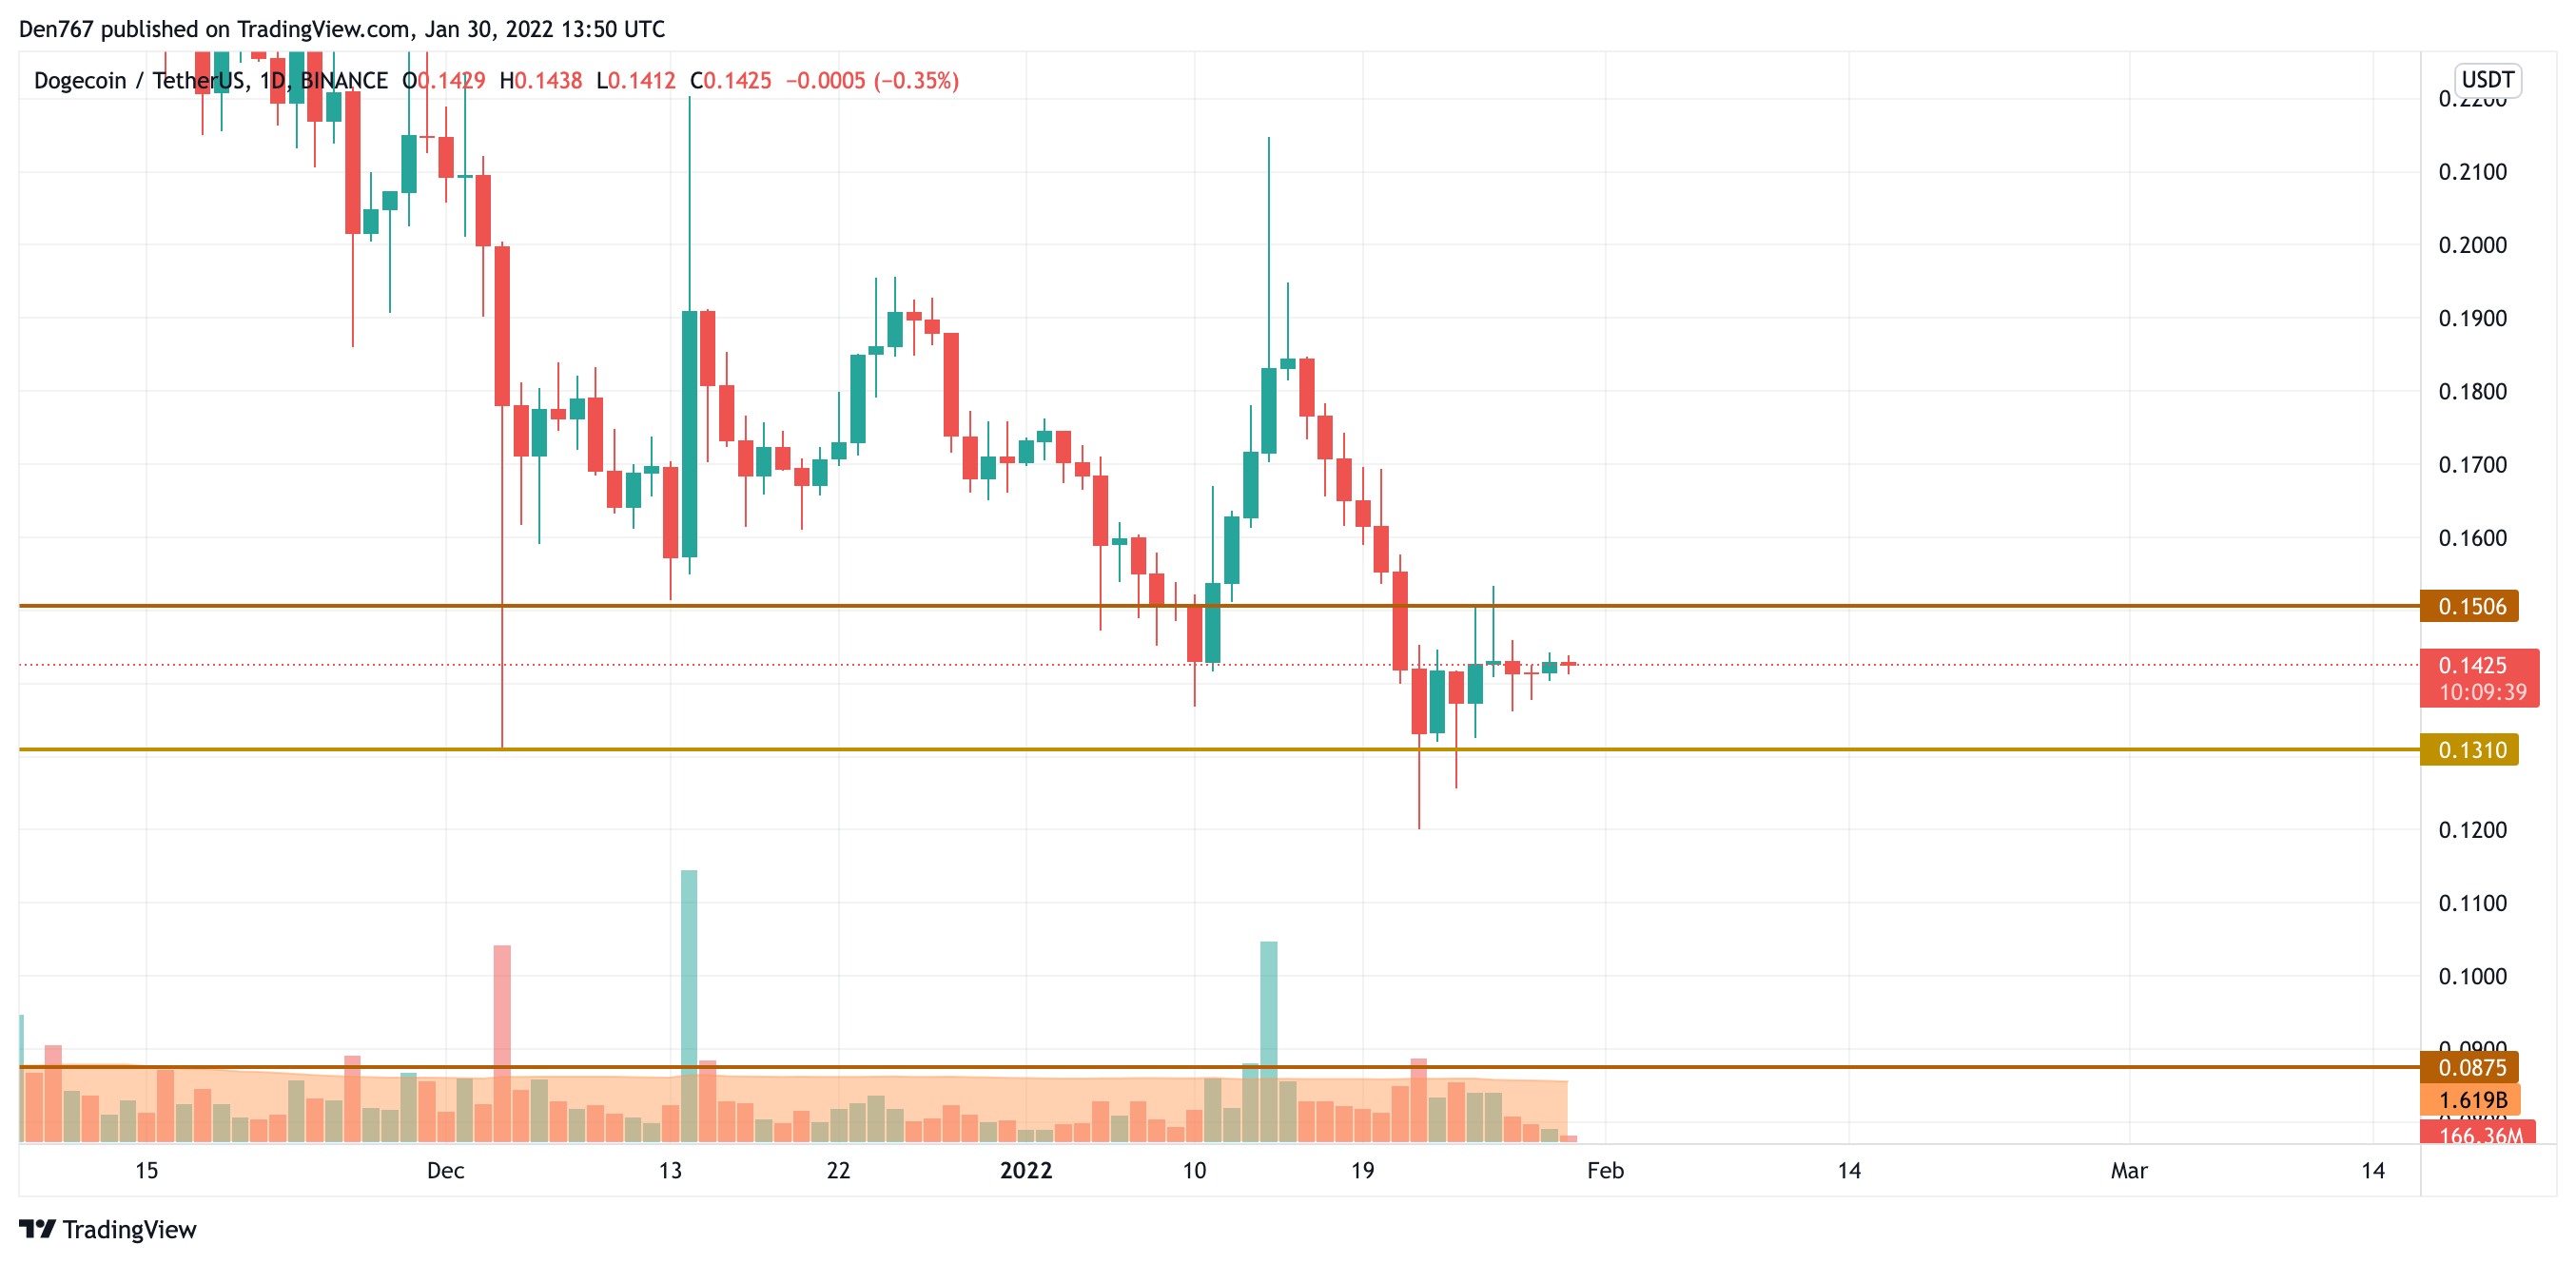
Despite the fall, DOGE is trading sideways as the rate is located between the support at $0.1310 and the resistance at $0.1506.
At the moment, the price is closer to the resistance, which means that bulls are more powerful than bears to a certain extent. In this regard, if buyers fix above the $0.15 zone, the rise may continue to $0.16 shortly.
DOGE is trading at $0.1425 at press time.
AVAX/USD
Avalanche (AVAX) is not an exception to the rule, declining by 1.17%.
AVAX/USD chart by TradingView
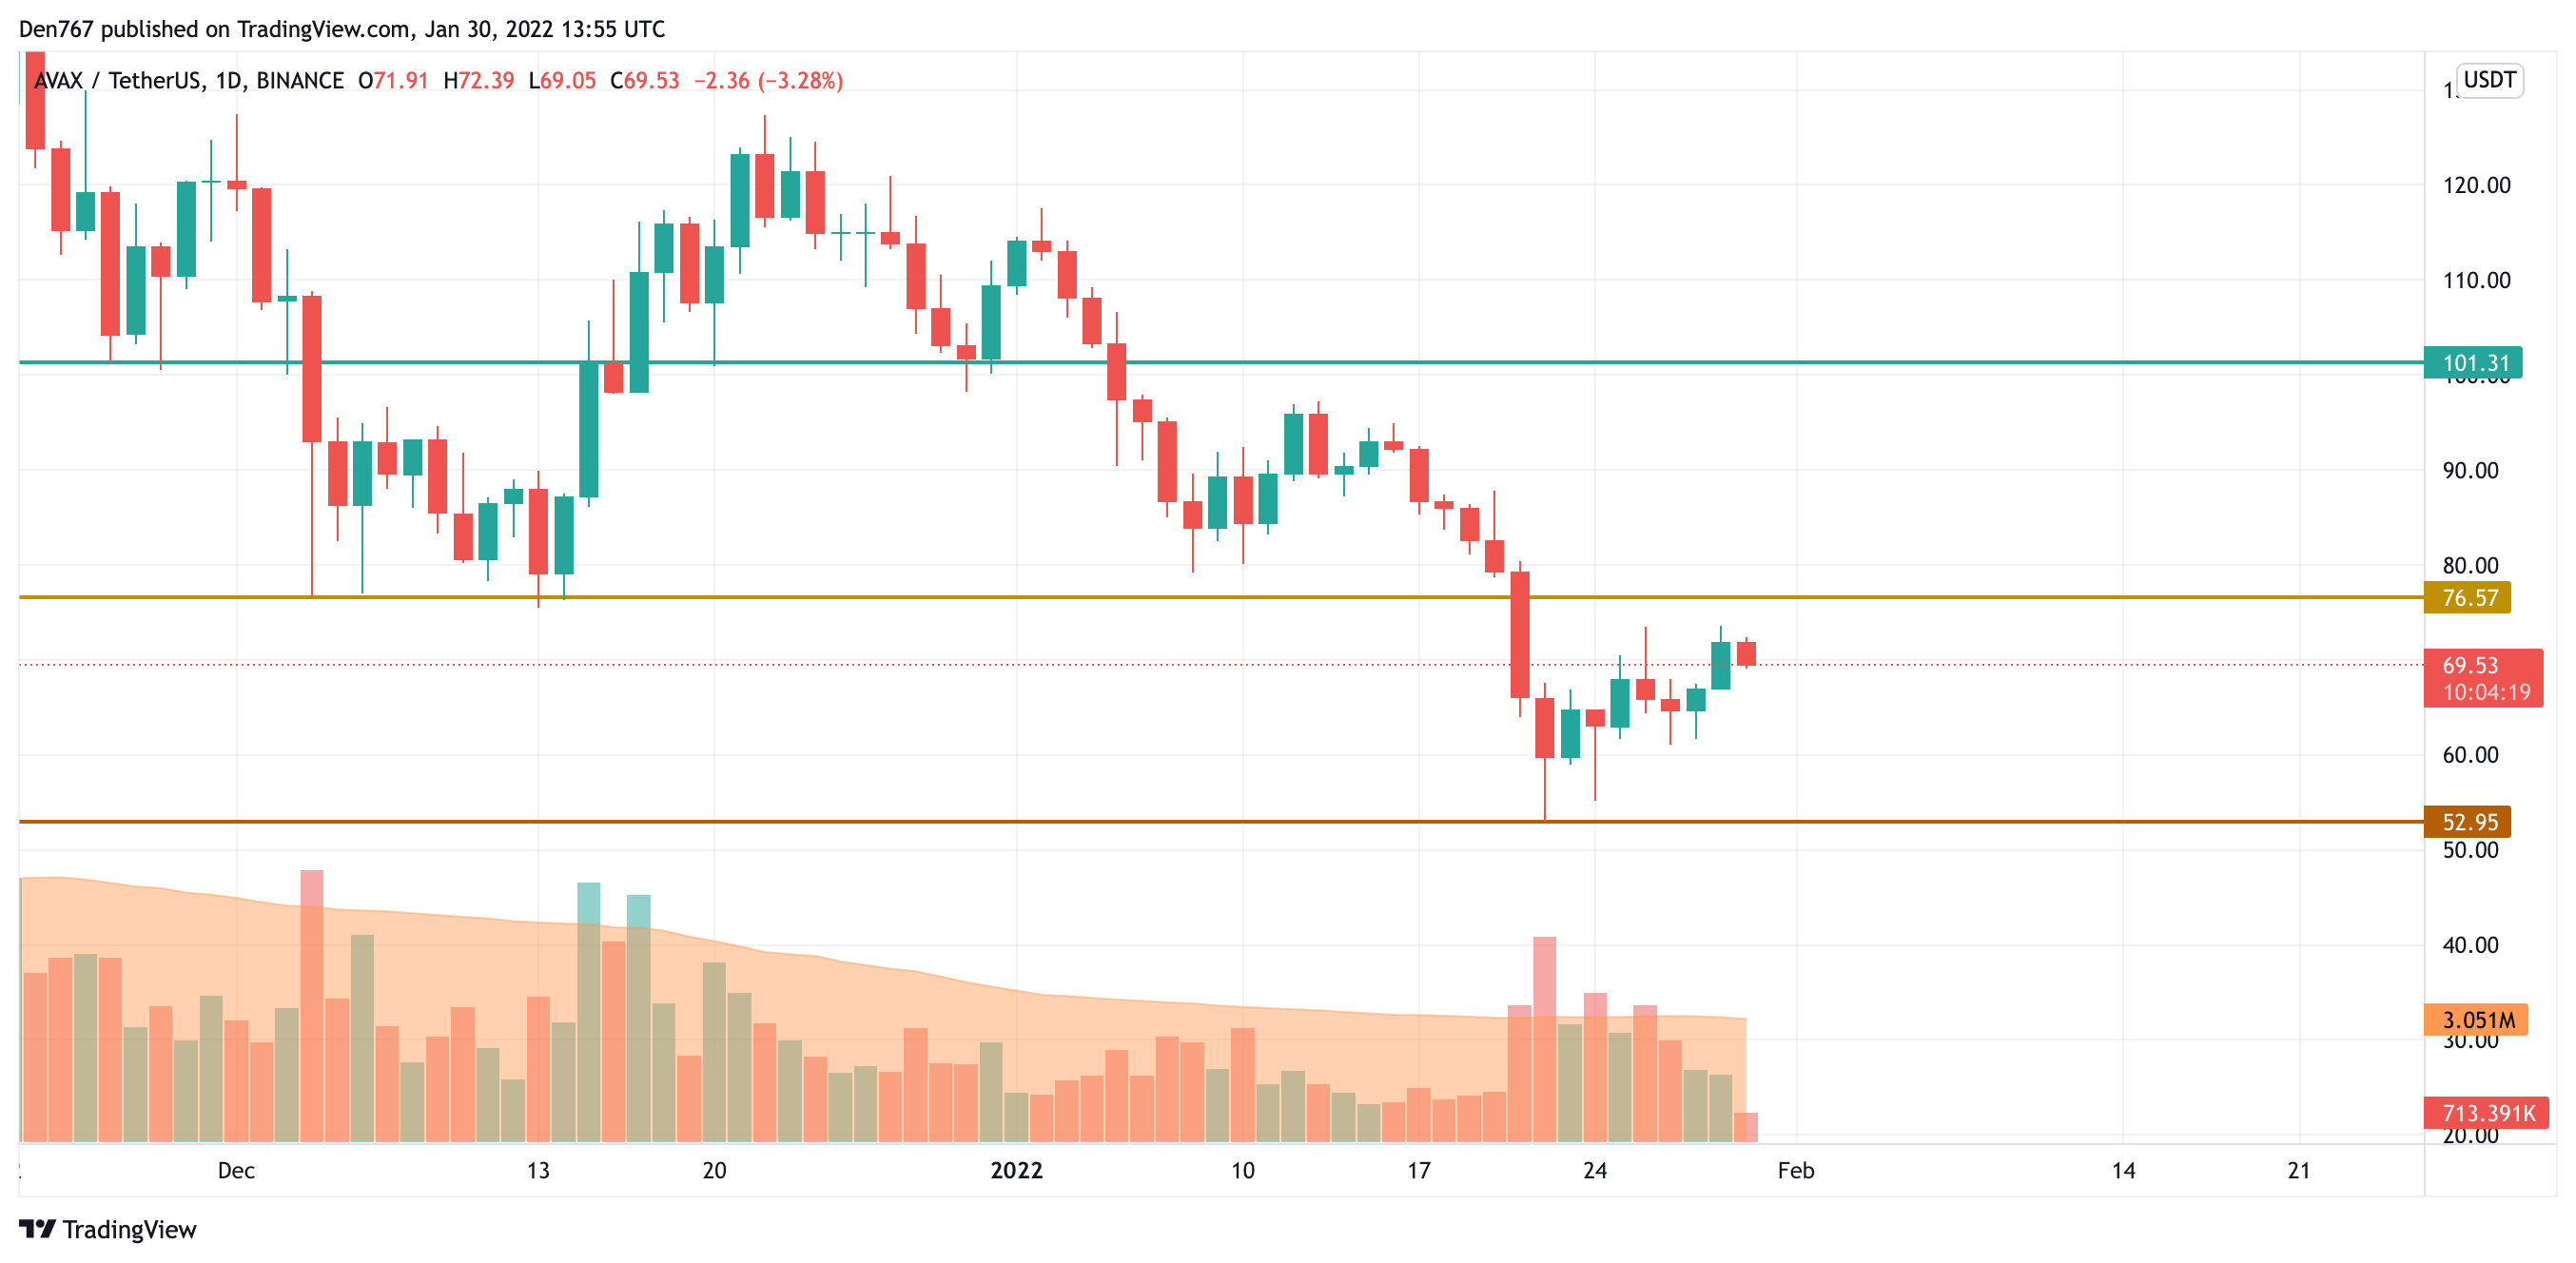
AVAX is located closer to the resistance level at $76.57. The selling volume has declined, which means that bears are losing their initiative. If buyers can take this chance and return the rate above $80, AVAX can come back to the mid-term bullish trend.
AVAX is trading at $69.50 at press time.
Read full original article on U.Today
Author

Denys Serhiichuk
U.Today
With more than 5 years of trading, Denys has a deep knowledge of both technical and fundamental market analysis.




