What to watch for in ETH to book 30% gains
- Ethereum price is booming and is trading further away from its 2022 lows.
- ETH price still holds over 30% gains and could break above $2,000.
- Two main elements are present that need to stay intact as confirmation of the rally.

Ethereum (ETH) price action is printing a summer rally that started on July 13 and since then has been supported by the green ascending trendline that got identified when price action dipped in search of support near the 55-day Simple Moving Average (SMA) on July 26. The rally coincides with a shift in sentiment where traders could focus on a few elements that point to a possible rate cut at the beginning of 2023 and create the image of a goldilocks scenario. Precaution is needed as several Fed officials are pushing back on this, although the first official Fed rate decision is still forty days away, creating plenty of room for this rally to continue before investors start to fret and worry about what the Fed will do.
ETH price has a 40-day window to rally in
Ethereum price gets plenty of support from the green ascending trend line mentioned in the opening statement above. An additional measure is added as bulls could reclaim $1,688 and now act as a double belt of security with the green ascending trend line. As price action will continue to climb, expect that level to lose its supportive power once that happens, and for now, it offers a great entry for another leg up.
ETH price could first jump towards $1,928 with the purple line identified for a pivotal historical level and just a few dollars below the monthly R1, which is on the dot at $2,000. On the one hand, a big psychological level will be working as a magnet to pull price action higher and, in the meantime, will act as an intermediary level to book profits, seeing its relevance. Given the time horizon until the next Fed rate decision, a test at $2,278 would be possible and makes sense as the monthly R2 resistance falls in line with the 200-day SMA for now and will work as a cap on any further upward moves.
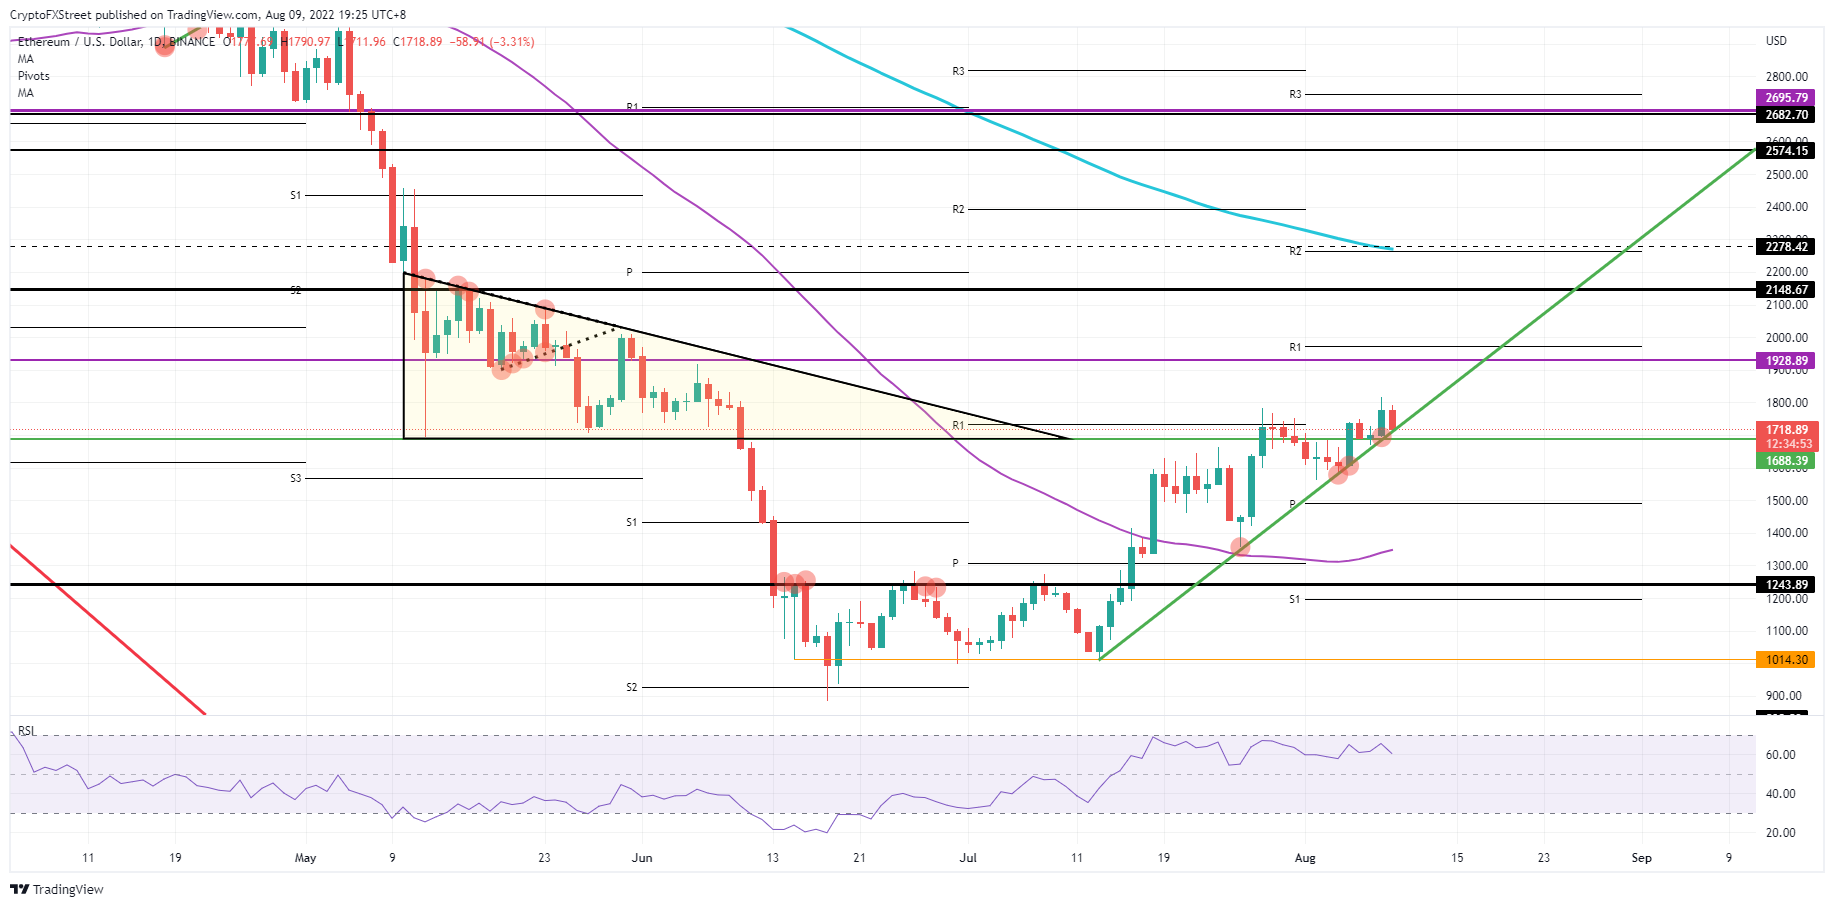
ETH/USD Daily chart
The risk is that the double support belt does not hold. A break below $1,688 could see ETH spiral out of control and fall like a knife towards $1,400 – to look for support at the 55-day SMA and with $1,243 as the bottom line. That last level and the last line of defence once breached, guarantees new lows for 2022.
Author

Filip Lagaart
FXStreet
Filip Lagaart is a former sales/trader with over 15 years of financial markets expertise under its belt.


