What to expect after the 15% spike from Solana price
- Solana price has rallied 15% during the final week of October.
- A Fibonacci retracement tool shows the current consolidation as shallow while the volume remains low, hinting that the uptrend will continue.
- Invalidation of the bullish thesis is a breach below $28.25.

Solana price rallies 15% in sky-rocket-like fashion, key levels have been identified to gauge the strength of the bulls.
Solana price show strength
Solana price has pulled off an impressive rally as the bulls have induced a 15% rally since Monday's opening bell. Solana, the centralized smart contract token, breached the 8-day and 21-day simple moving averages on October 24 while dually flying into overbought conditions on the Relative Strength Index. Based on these signals, the SOL price could be in the beginning stages of a much larger move.
Solana price currently auctions at $31.23 as a profit-taking consolidation occurs just above the recently breached 21-day simple moving average. The volume above the breached indicator is less than the large engulfing candle that pierced through it, which is a subtle gesture of bullish strength. A Fibonacci retracement tool surrounding the piercing candle shows the price as just a 38.2% retracement level, which further fuels the idea that the uptrend move is not yet over.
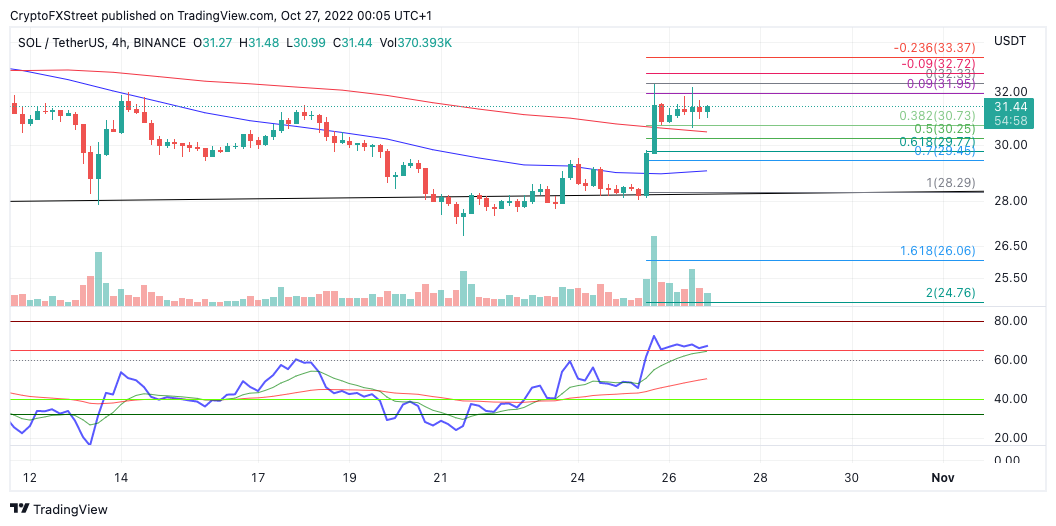
SOL/USDT 4-Hour Chart
Solana price next bullish targets lie at the previously broken support zone of $33 and $34.50. Invalidation of the uptrend thesis could be a breach below the thrust candle at $28.25. If the bears tag this level, an additional 15% move south could occur, targeting liquidity levels near $26.
Author

Tony M.
FXStreet Contributor
Tony Montpeirous began investing in cryptocurrencies in 2017. His trading style incorporates Elliot Wave, Auction Market Theory, Fibonacci and price action as the cornerstone of his technical analysis.



