Uniswap Price Forecast: UNI flashes bearish breakout risk amid reduced demand
- Uniswap edges lower by nearly 3% on Thursday, risking a bearish breakout of a short-term consolidation.
- A steady decline in Uniswap’s TVL and fees reflects reduced user interest.
- Derivatives data reveal a capital outflow from UNI futures, indicating a risk-off sentiment among traders.

Uniswap (UNI) trades in the red on Thursday, for the third consecutive day, as bears eye a potential downside breakout from an 18-day consolidation range. Data shows that the Total Value Locked (TVL) on Uniswap and its weekly fees are declining, indicating reduced user demand. On the derivatives side, a drop in UNI futures Open Interest suggests a tapering of risk exposure among traders.
Reduced user demand and bearish bias in Uniswap derivatives
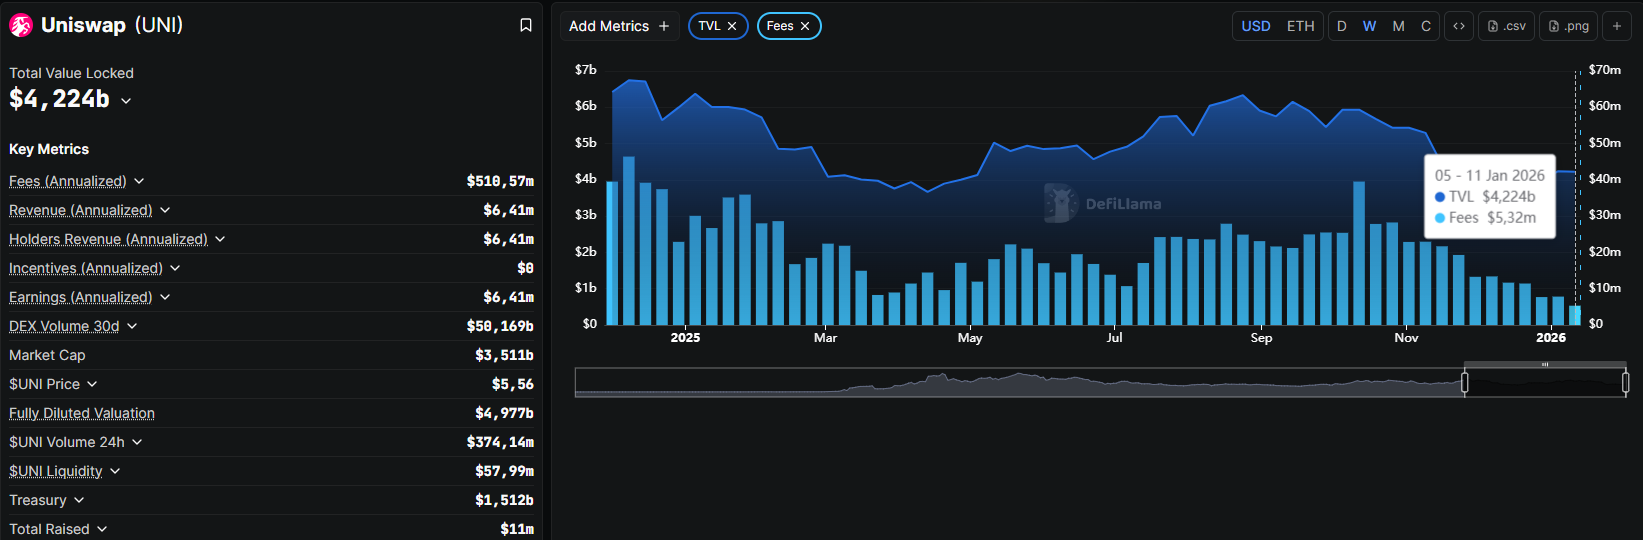
Uniswap has experienced reduced user demand since early October, as evidenced by declines in weekly fees and TVL. DeFiLlama data shows a steady decline in TVL to $4.224 billion this week, from $5.935 billion in early October, suggesting that users are withdrawing digital assets from the exchange.
Additionally, the decline in weekly fees, which stands at $5.32 million so far this week, down from $39.53 million in the first week of October, aligns with a reduction in TVL. This confirms a decrease in user activity, which could negatively impact the holding capacity and intent of UNI holders.
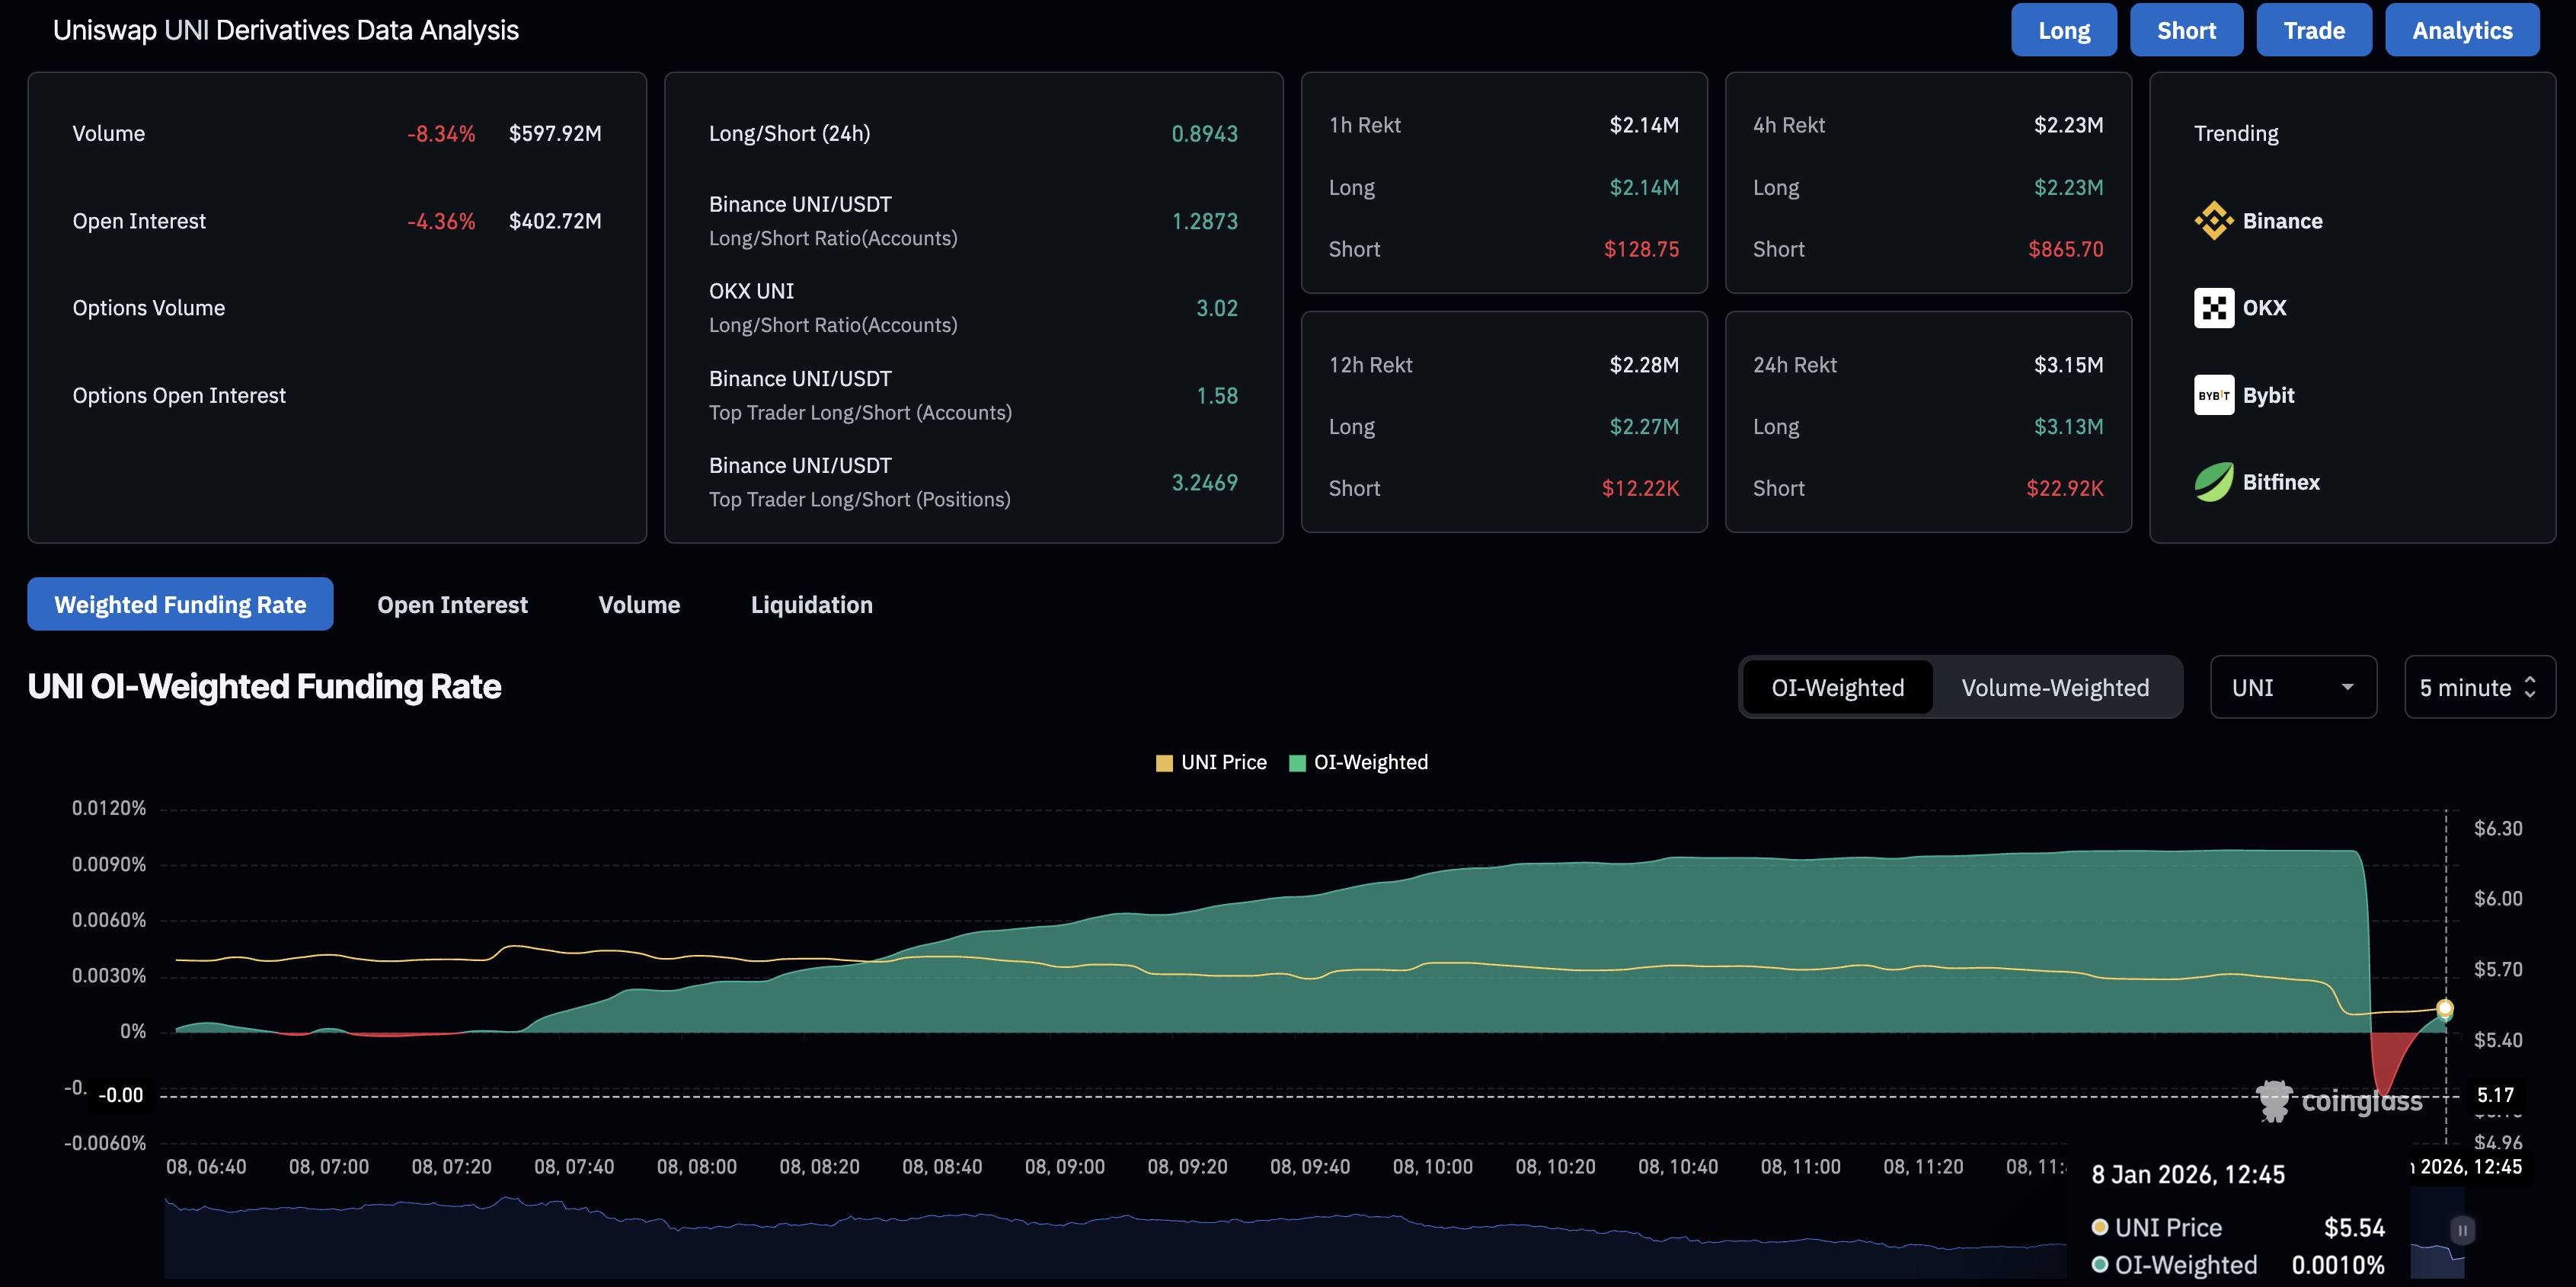
On the derivatives side, CoinGlass data shows a 4.36% decline in UNI futures Open Interest (OI) over the last 24 hours, to $402.72 million. This suggests that the traders are limiting their risk exposure by either closing positions or reducing leverage.
Meanwhile, the funding rate hovers around 0.0010%, recovering after a steep pullback to -0.0034% earlier in the day. Still, the broader pullback indicates a loss in traders’ sentiment to pay the extra premium to hold long positions.
Uniswap flashes downside risk as selling pressure mounts
Uniswap edges lower by nearly 3% at press time on Thursday, crossing below the December 24 low at $5.59. If UNI closes the day below this level, it would confirm a bearish breakout of an 18-day consolidation range with the upper ceiling aligning with the December 21 high at $6.50.
A potential downside breakout could extend UNI’s decline toward the $5.00 psychological mark, followed by the December 18 low at $4.84.
The technical indicators on the daily chart take a bearish shift amid Uniswap’s three-day decline. The Relative Strength Index (RSI) is at 44, crossing below the midline and aiming for the oversold zone. This suggests rising selling pressure and increases downside risk.
Meanwhile, the Moving Average Convergence Divergence (MACD) crosses below the signal line, flashing a sell signal and a renewed bearish momentum.
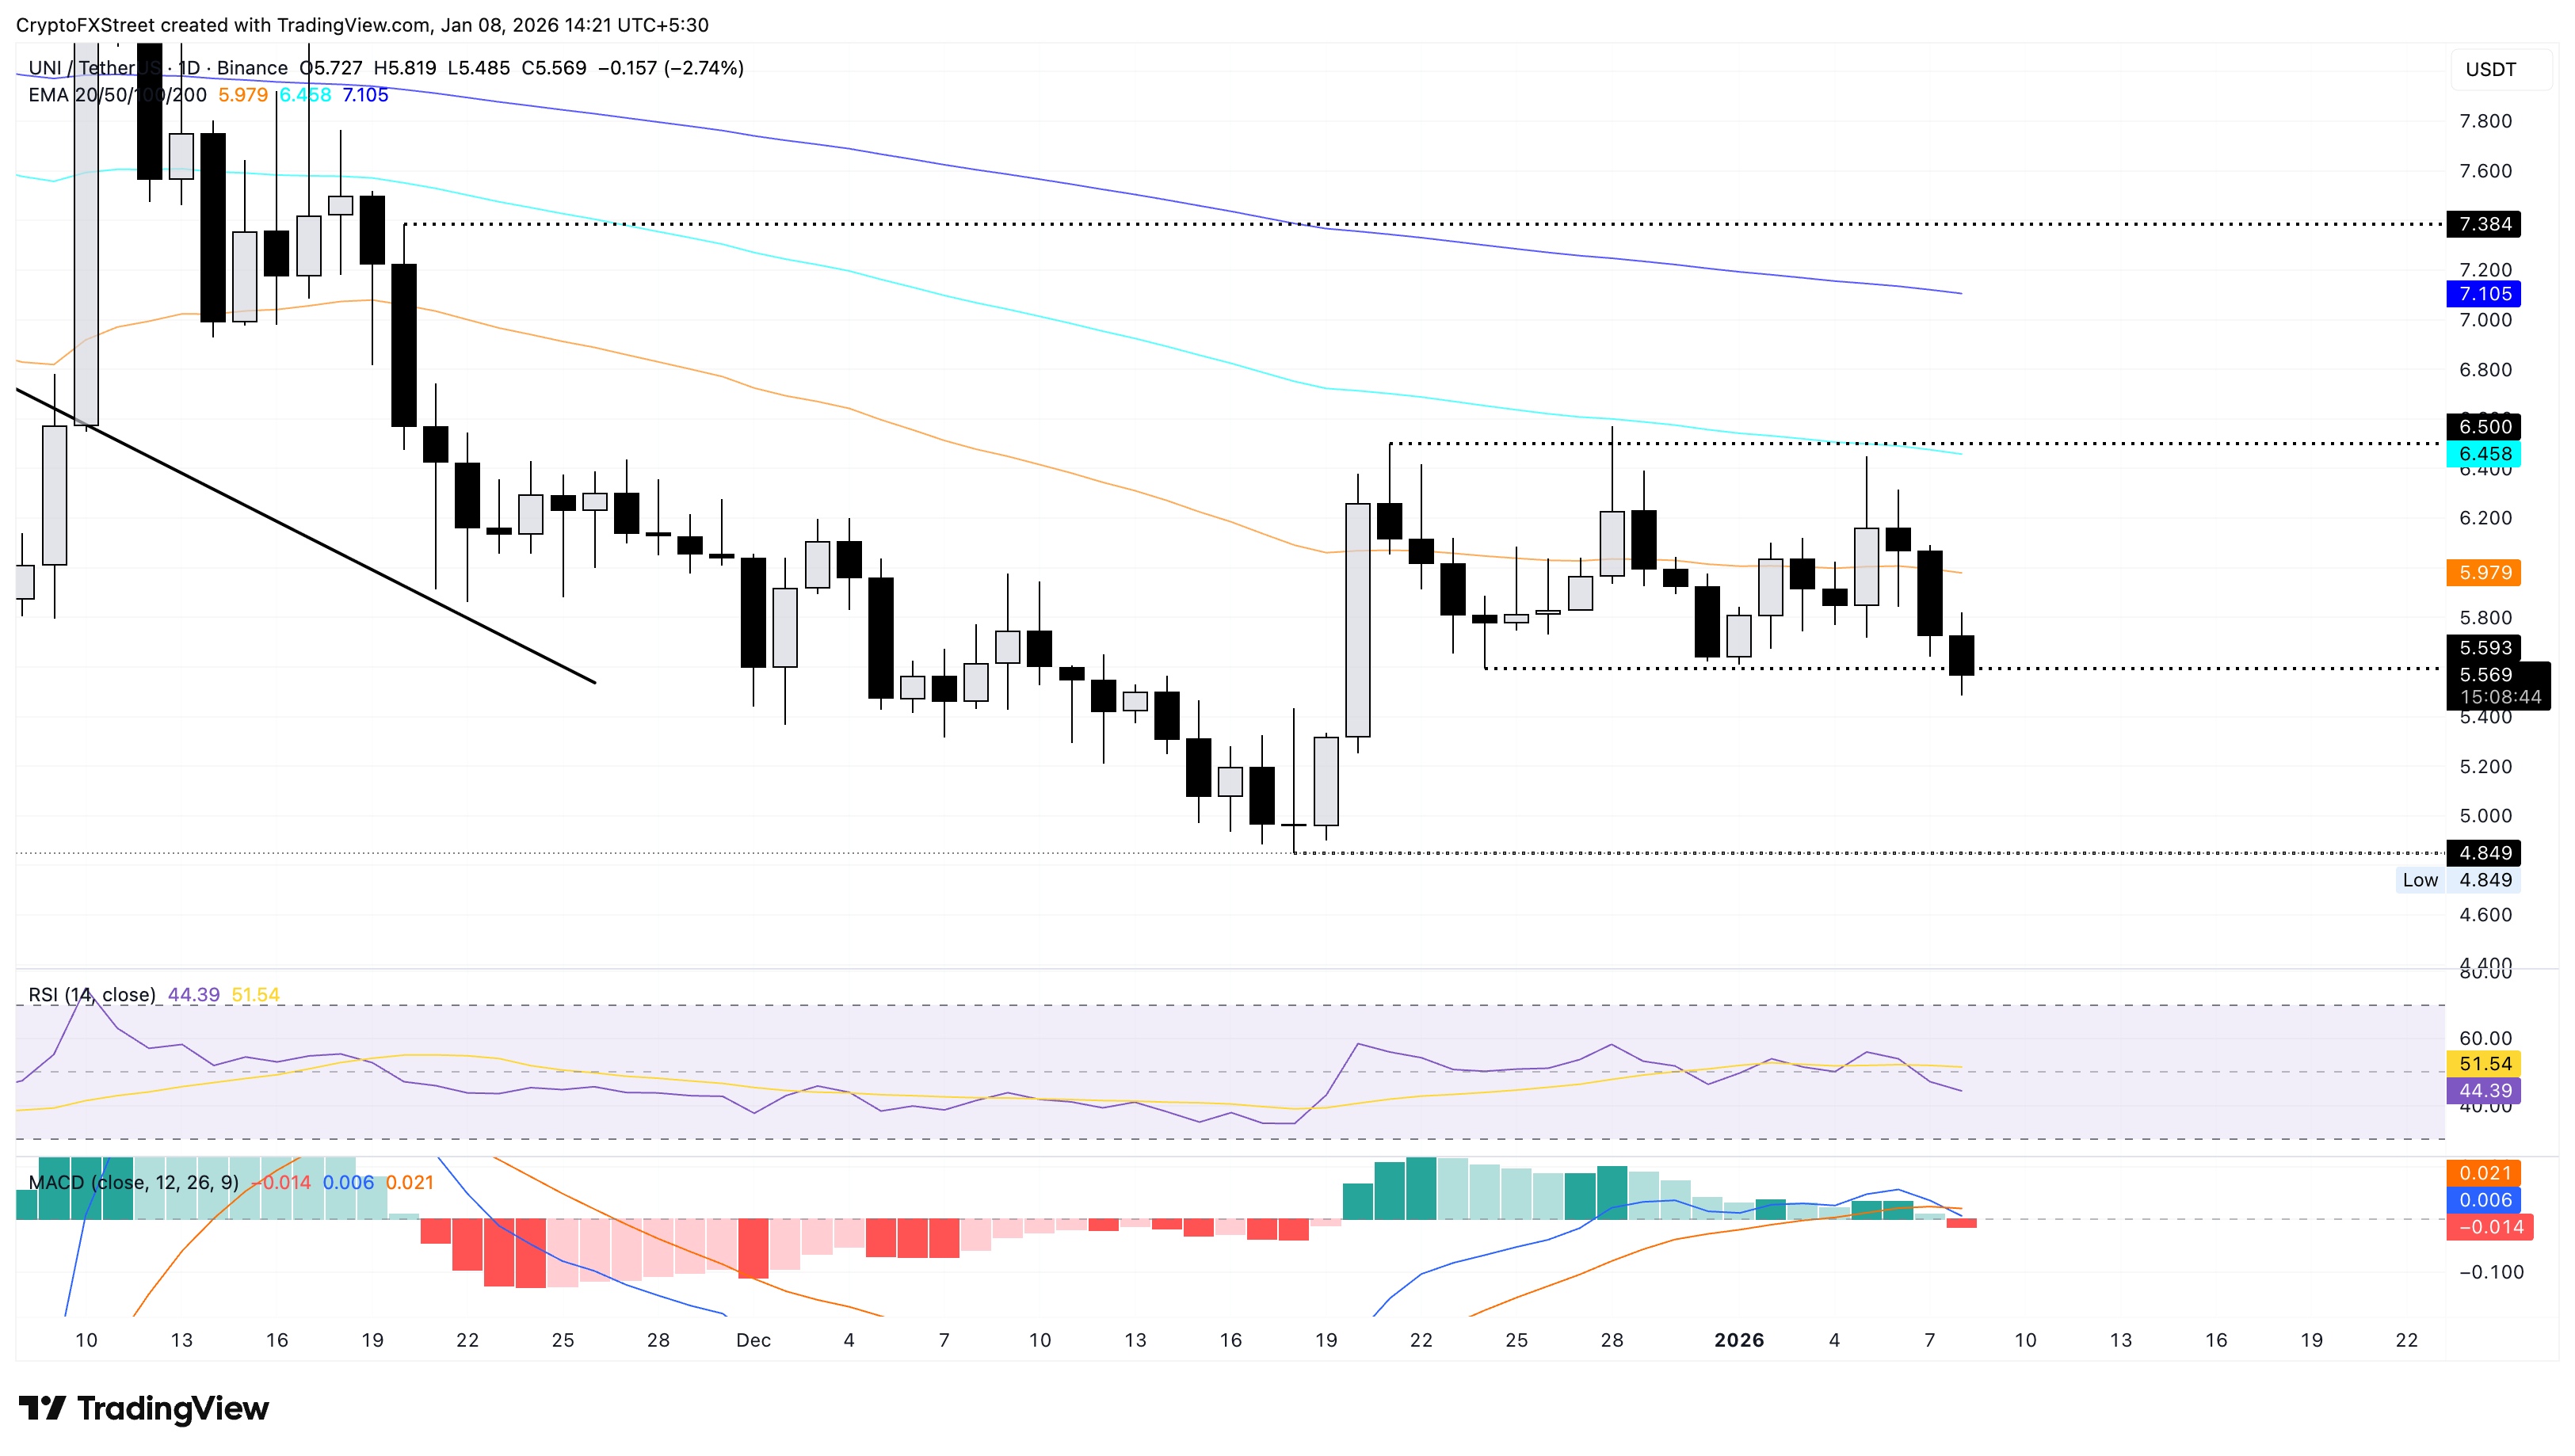
Looking up, if UNI holds above $5.59, a potential rebound could extend its consolidation, targeting the $6.50 ceiling.
Author

Vishal Dixit
FXStreet
Vishal Dixit holds a B.Sc. in Chemistry from Wilson College but found his true calling in the world of crypto.


