Weekly On-chain Update: Why Bitcoin risks sell-off to $112K before next rally
- Bitcoin's upside faces exhaustion as the RSI falls from overbought territory to 56.
- Bitcoin's Daily Active Addresses dip moderately from 725K to 708K, indicating cooling speculative interest.
- Bitcoin on-chain transfer volume slides sharply by 23.1% to $10.8 billion, suggesting a slowdown in economic activity on the network.

Bitcoin (BTC) price is extending its intraday decline below $118,000 on Tuesday, reflecting changing market dynamics. The decline follows several attempts by the bulls to close the gap to $120,000, following last week's sell-off to $114,728.
Key indicators suggest that this decline could extend in upcoming sessions, reflecting the shift in investor focus to macroeconomic events in the United States (US).
The Federal Reserve (Fed) will make its decision on interest rates on Wednesday, with the market expecting the rates to remain unchanged in the range of 4.25% to 4.50%. Fed Chair Jerome Powell's speech would be of more importance, providing insight into the central bank's policy direction.
Investors will also pay attention to US President Donald Trump's reciprocal tariffs taking effect on Friday. Navigating the next few days will be critical for traders and the resumption of Bitcoin's uptrend, with bulls aiming for a break above $120,000.
Bitcoin triggers market-wide cooldown
The surge in Bitcoin price to fresh all-time highs triggered subsequent rallies in altcoins, front-lined by Ethereum (ETH) approaching the $4,000 mark and Ripple (XRP) reaching a new all-time high of $3.66.
Still, Bitcoin's upside-heavy outlook, characterised by a cooling spot market and a notable correction in some on-chain metrics, could put the brakes on the coveted altcoin season.
Bitcoin's Daily Active Addresses metric declined moderately by 2.4% from approximately 725,000 to 708,000, a move that indicates a slight contraction in user engagement and transaction activity following the record high.
A continued decline in the metric would indicate a significant drop in speculative interest or a broader decline in on-chain participation as users step back to allow for price consolidation before the next leg up.
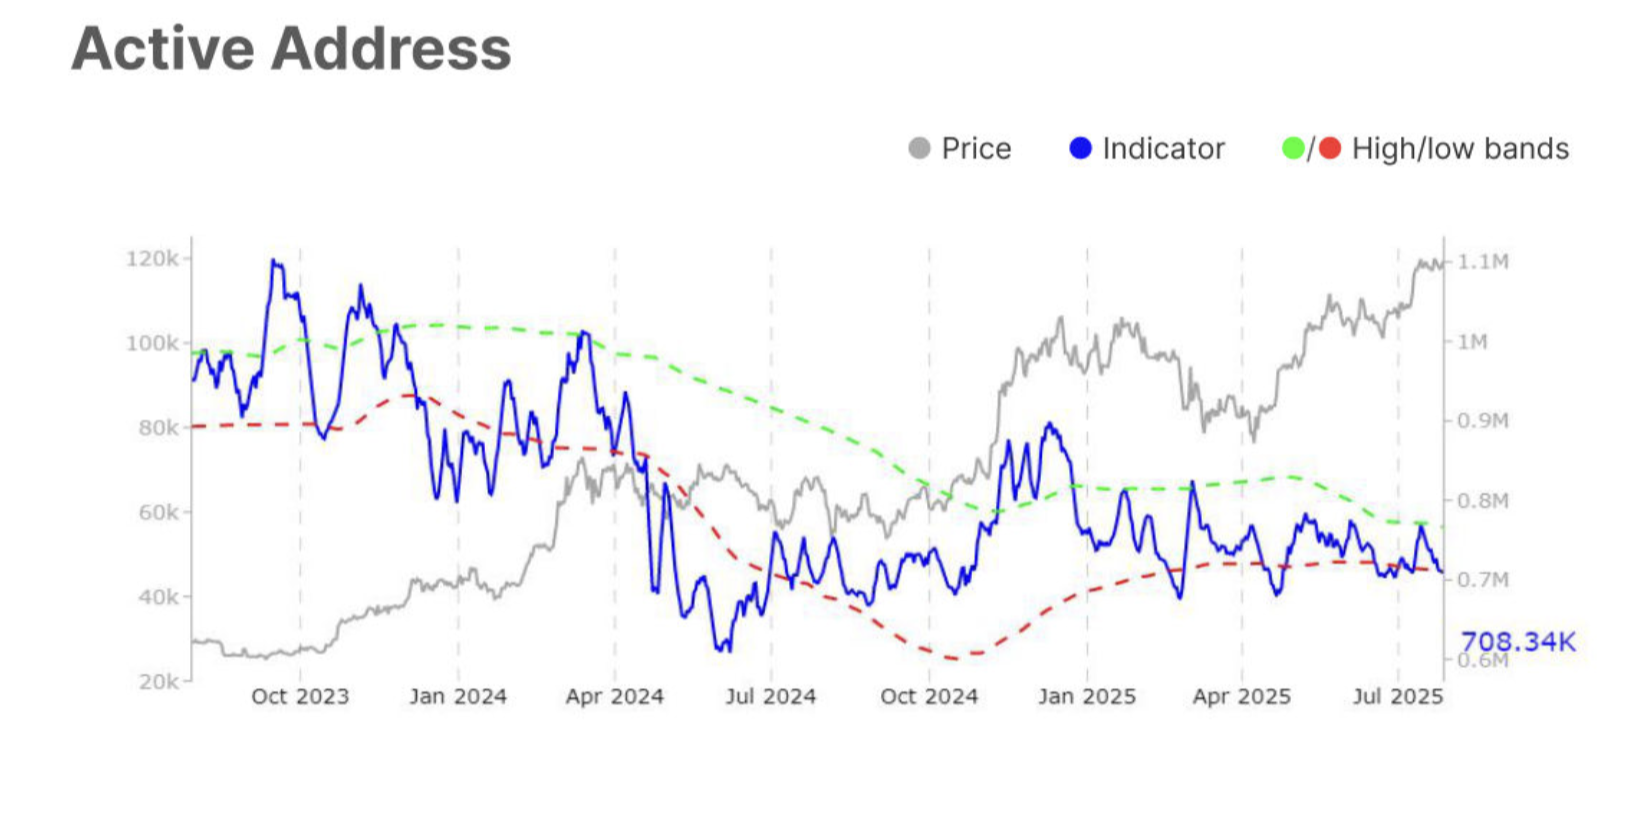
Bitcoin Active Addresses metric | Source: Glassnode
Glassnode highlights Bitcoin's On-chain Transfer Volume as another key metric of interest to investors. According to the chart below, the blue line is down by 23.1% from $14 billion to $10 billion, which points to a slowdown in the network's economic activity. In other words, less capital is flowing across the chain on the backdrop of the surge to the new all-time high.
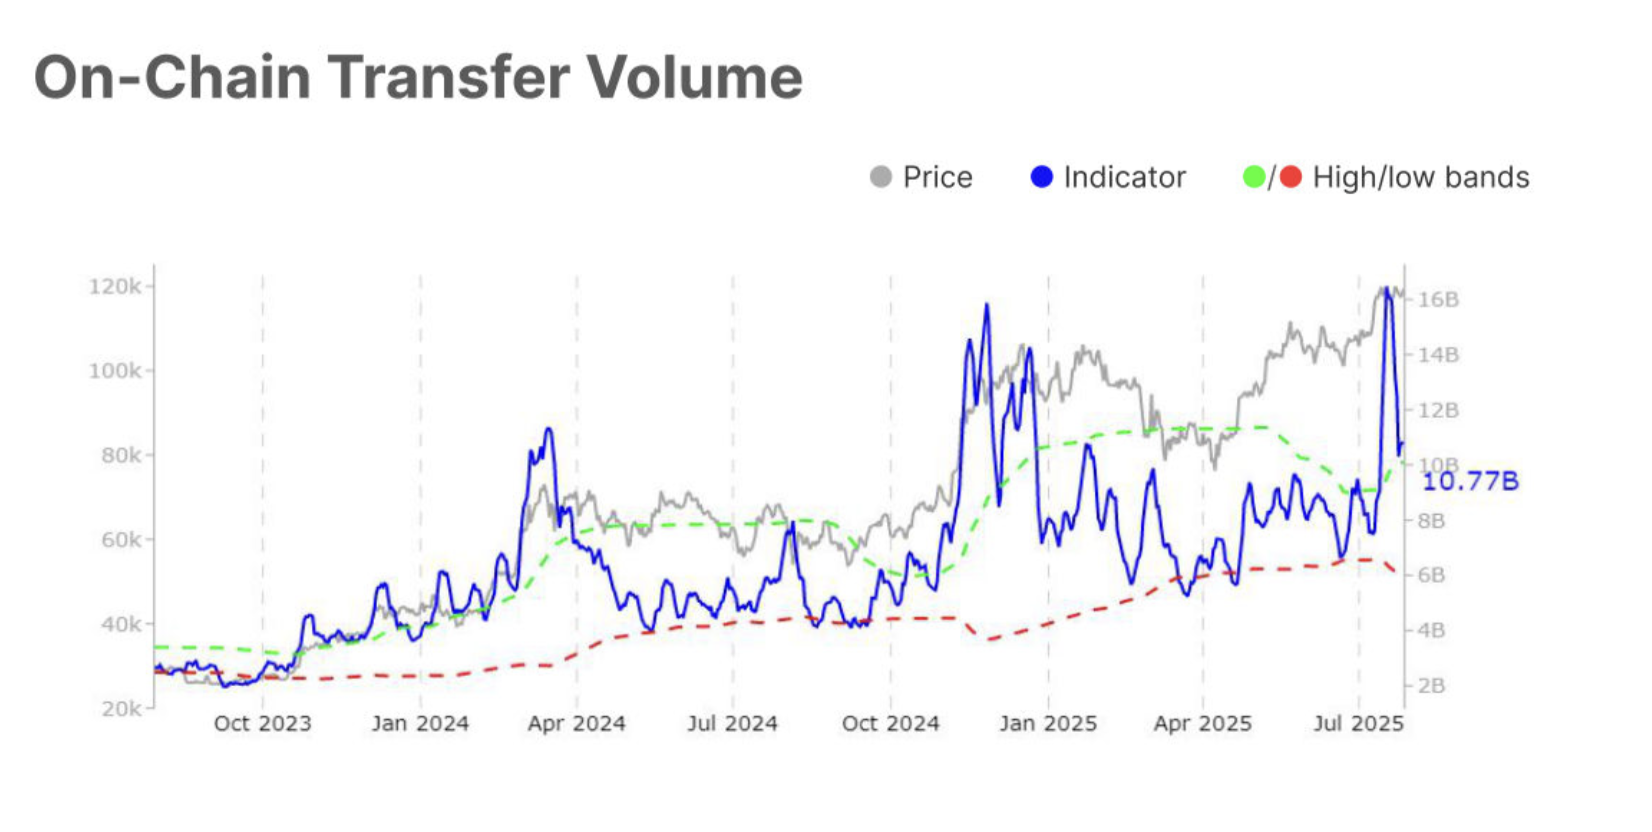
Bitcoin On-chain Volume metric | Source: Glassnode
The percentage of Supply in Profit has edged higher from 96.7% to 96.9%, indicating that the majority of BTC holders are sitting on unrealized profit, a situation that reflects bullish sentiment.
"However, such a widespread profitability can also increase the risk of sell-side pressure as investors look to secure gains. For now, the sustained high reading reflects confidence, though continued stability depends on profit-taking pace," Glassnode highlighted in its Weekly Market Pulse report.
Technical outlook: Why Bitcoin's pullback could extend
Bitcoin's price is no longer trading in overheated market conditions after the Relative Strength Index (RSI) dropped to 56 from an overbought high of 75. This decline indicates buyer exhaustion, with the spot volume falling to $8.6 billion, according to Glassnode. If the spot volume continues to cool, it would signal "a wait-and-see" approach from market participants, characterised by lower conviction to buy or sell aggressively.
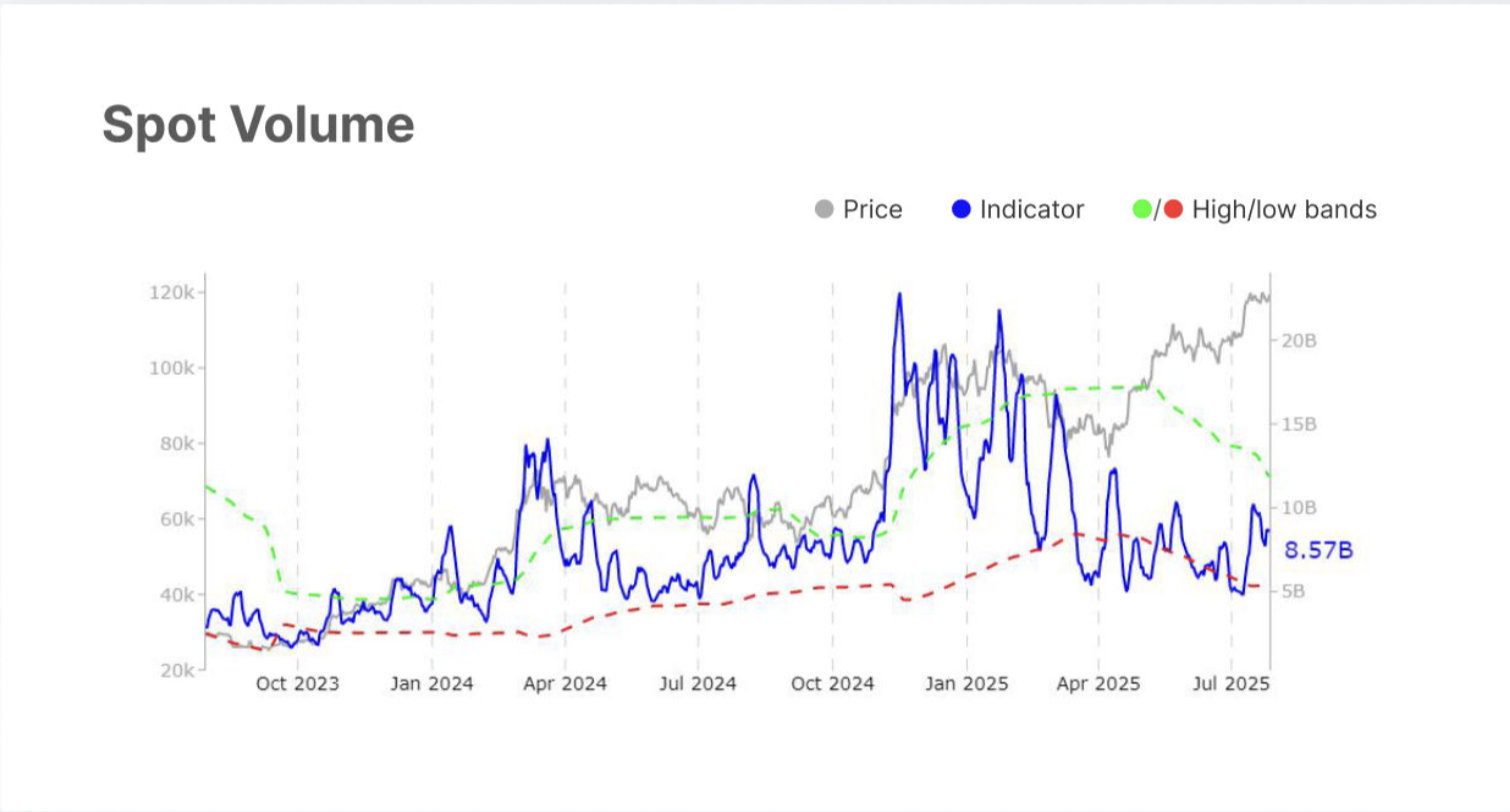
Bitcoin Spot Volume | Source: Glassnode
A buy signal maintained by the Moving Average Convergence Divergence (MACD) indicator since Wednesday affirms bears are tightening their grip. Traders will continue to reduce exposure as this indicator drops toward the mean line and red histogram bars expand.
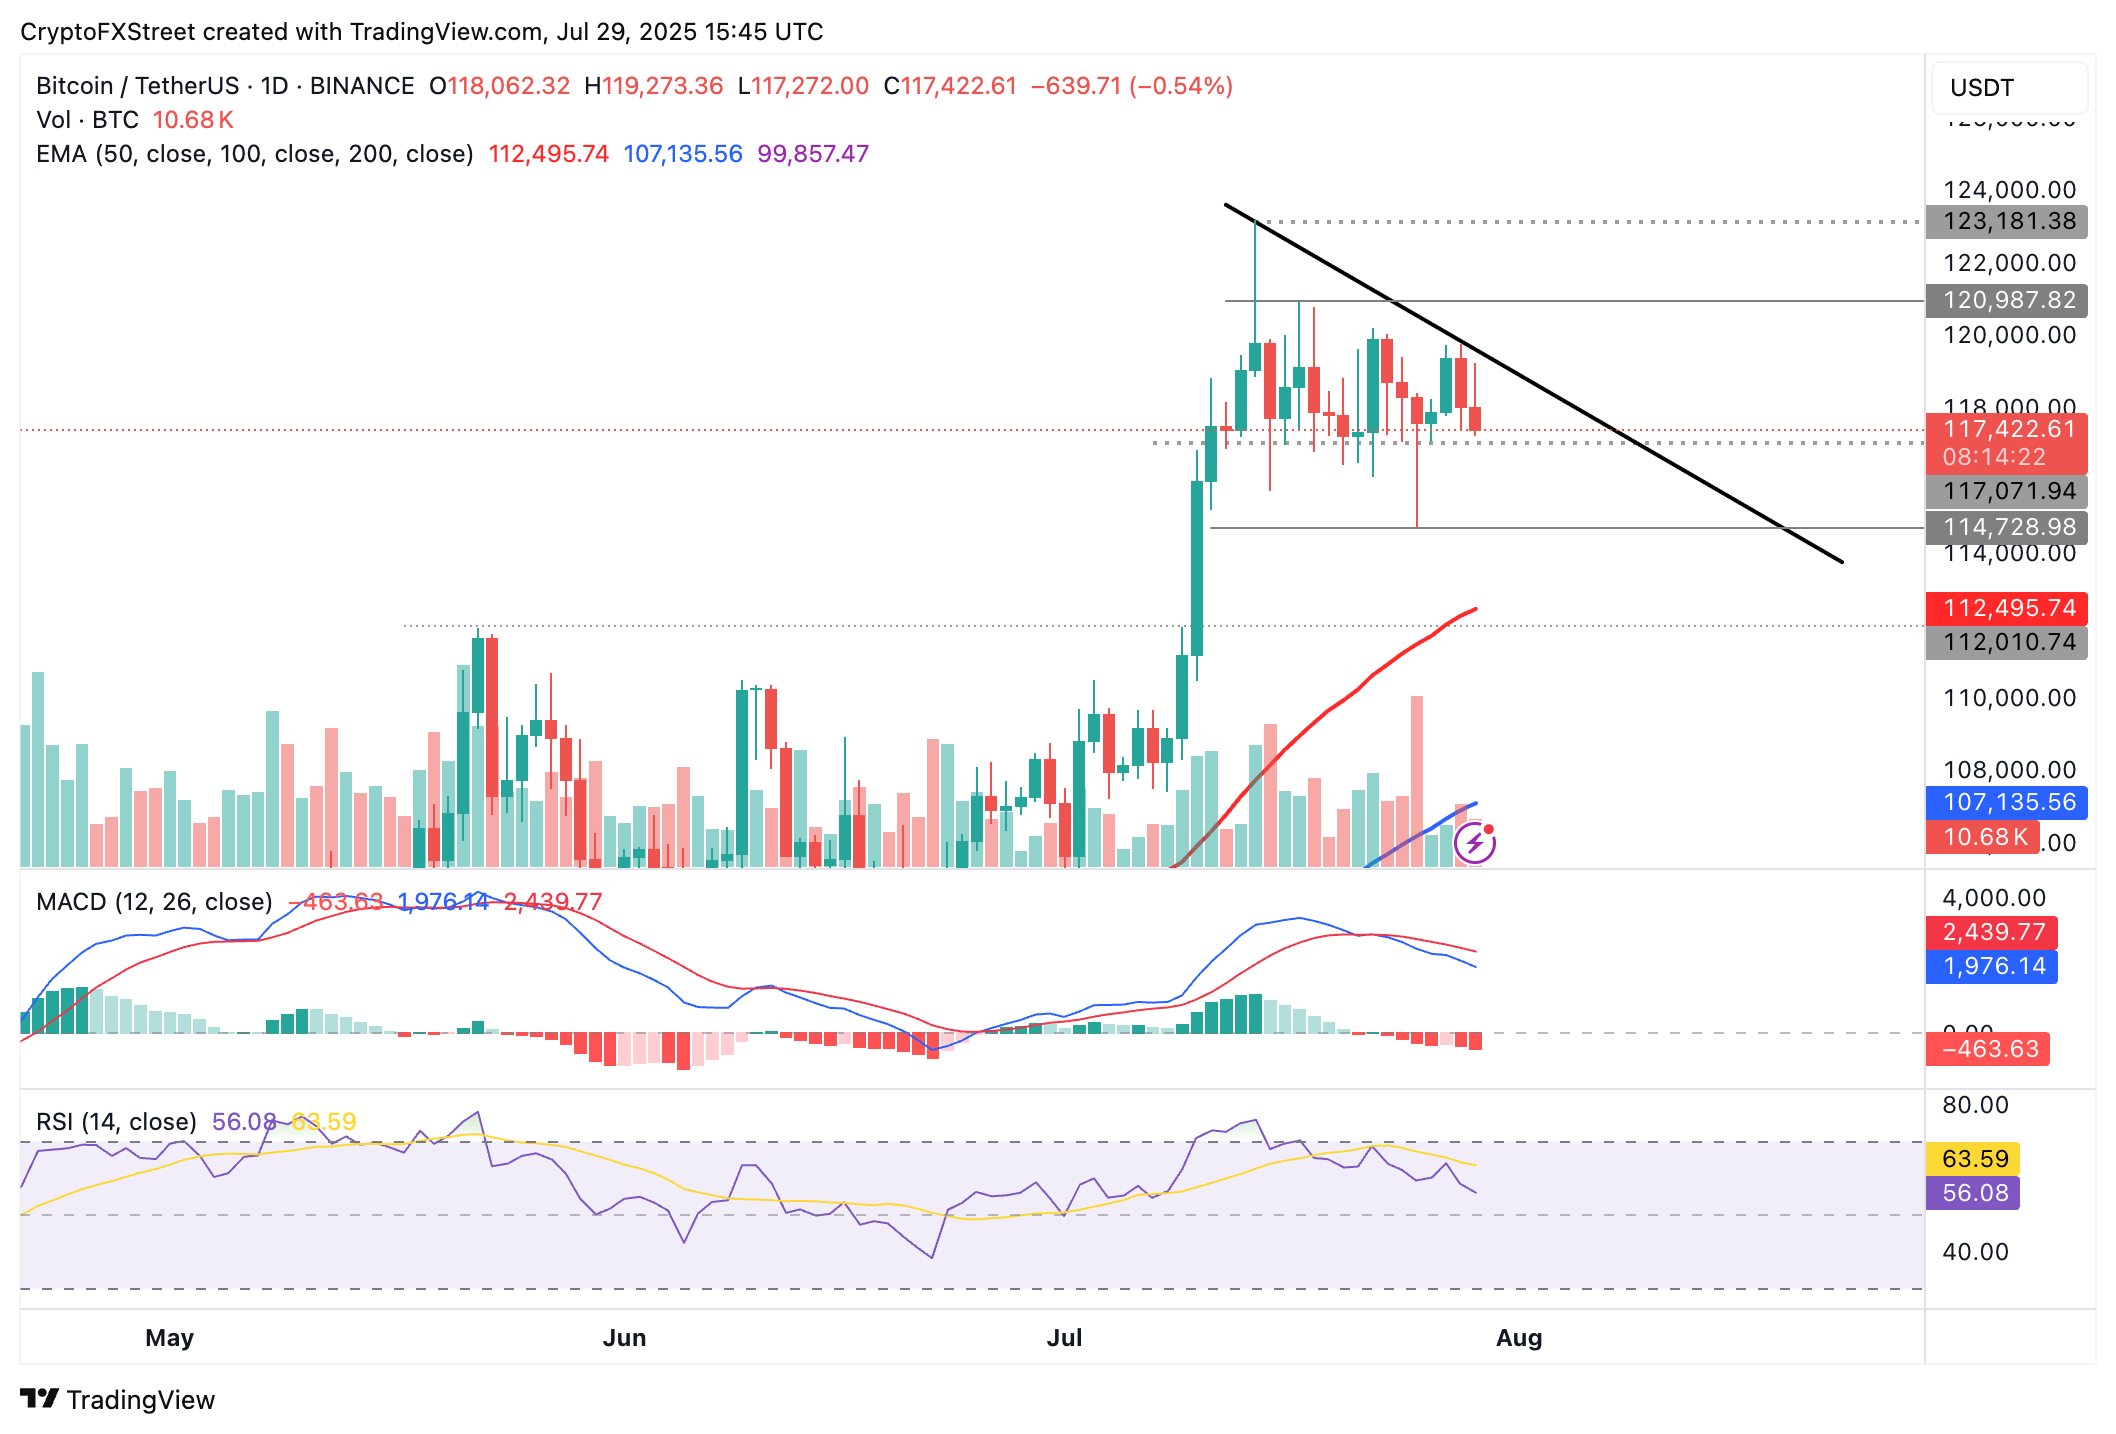
BTC/USDT daily chart
Key areas of interest to traders include the support around $115,000, tested on Friday, the 50-day Exponential Moving Average (EMA) at $112,495, and the previous all-time high around $112,000 in case the decline in Bitcoin price persists.
Cryptocurrency metrics FAQs
The developer or creator of each cryptocurrency decides on the total number of tokens that can be minted or issued. Only a certain number of these assets can be minted by mining, staking or other mechanisms. This is defined by the algorithm of the underlying blockchain technology. On the other hand, circulating supply can also be decreased via actions such as burning tokens, or mistakenly sending assets to addresses of other incompatible blockchains.
Market capitalization is the result of multiplying the circulating supply of a certain asset by the asset’s current market value.
Trading volume refers to the total number of tokens for a specific asset that has been transacted or exchanged between buyers and sellers within set trading hours, for example, 24 hours. It is used to gauge market sentiment, this metric combines all volumes on centralized exchanges and decentralized exchanges. Increasing trading volume often denotes the demand for a certain asset as more people are buying and selling the cryptocurrency.
Funding rates are a concept designed to encourage traders to take positions and ensure perpetual contract prices match spot markets. It defines a mechanism by exchanges to ensure that future prices and index prices periodic payments regularly converge. When the funding rate is positive, the price of the perpetual contract is higher than the mark price. This means traders who are bullish and have opened long positions pay traders who are in short positions. On the other hand, a negative funding rate means perpetual prices are below the mark price, and hence traders with short positions pay traders who have opened long positions.
Author

John Isige
FXStreet
John Isige is a seasoned cryptocurrency journalist and markets analyst committed to delivering high-quality, actionable insights tailored to traders, investors, and crypto enthusiasts. He enjoys deep dives into emerging Web3 tren




