Ethereum Price Forecast: ETH set a new year-to-date high, next target above $4,000
- Ethereum price rebounds after testing its daily level of $3,730 on Tuesday, following a new year-to-date high of $3,941 the previous day.
- Institutional demand for ETH continues to strengthen, with ETH ETFs adding a further 1.6 million ETH in the past six weeks.
- Market participants should be cautious as the upcoming tariff deadline and macroeconomic data releases suggest a potentially volatile week for ETH.

Ethereum (ETH) price is rebounding above $3,800 at the time of writing on Tuesday after setting a new year-to-date high at $3,941 the previous day. Institutional demand for ETH remained robust, with the ETH Exchange Traded Funds (ETFs) adding a further 1.6 million ETH in the past six weeks. However, traders should keep a watch on potential volatility, with the upcoming US tariff deadline and the Federal Reserve’s (Fed) interest rate decision expected to drive volatility across crypto assets, including ETH.
Ethereum hits a new yearly high of $3,941
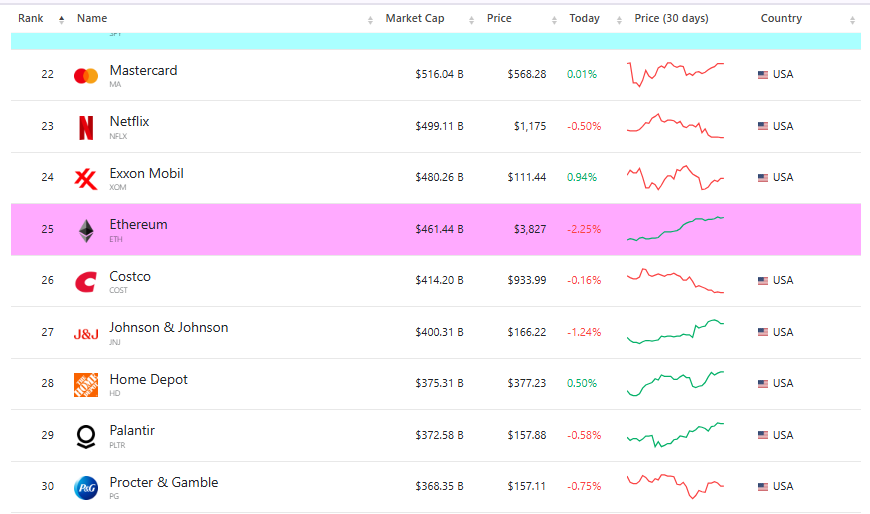
Ethereum price started the week on a positive note, soaring to a new year-to-date (YTD) high of $3,941 on Monday, but ended the day with a slight correction. So far in July, ETH has rallied by over 54%, and its market capitalization now exceeds $460 billion, placing it among the top 25 assets in the world, surpassing companies such as Costco and Johnson & Johnson.
Institutional demand rises, ETH outperforms BTC
The rising demand from institutional investors is supporting the surge in Ethereum’s price. A K33 Research report published on Tuesday states that Ethereum’s net Exchange Traded Fund (ETF) inflows crossed 1 million ETH on June 13. Since then, the inflows have accelerated aggressively, with ETH ETFs adding a further 1.6 million ETH in the past six weeks.
Alongside massive ETF flows, ETH has outperformed BTC heavily in July, with the ETH/BTC pair rallying from 0.023 to 0.032, pulling ETH/BTC to its highest mark since January 31.
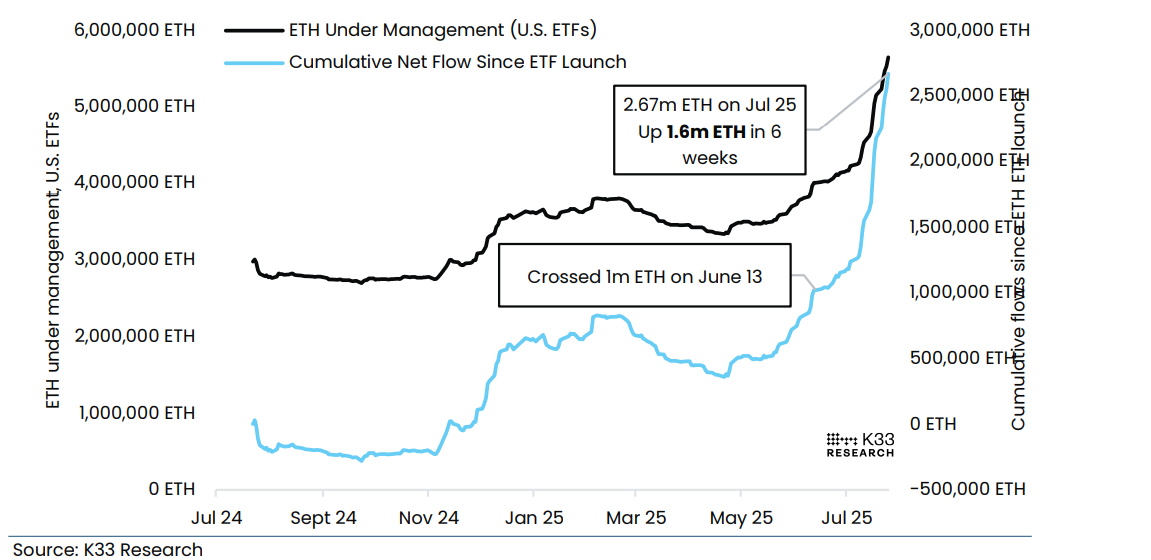
ETF Notional AUM vs. cumulative notional flow chart. Source: K33 Research
The report also highlights that the evolving active players in the Chicago Mercantile Exchange (CME) ETH futures have long been dominated by VolatilityShares. This 2x leveraged ETF issuer has represented more than 50% of CME’s ETH Open Interest (OI) since late March.
The graph below shows that the leveraged ETH ETF faces a 250,000 ETH increase in CME exposure in July, and active market participants engaging directly on CME sees the most substantial rise in CME OI. Active market participants increased their exposure from 331,224 ETH to 858,850 ETH in July, representing a substantial 527,000 ETH increase in exposure from this cohort. Alongside a relative futures basis premium compared to BTC and massive spot ETF flows, this suggests that institutional players are becoming more willing to build directional long exposure in ETH.
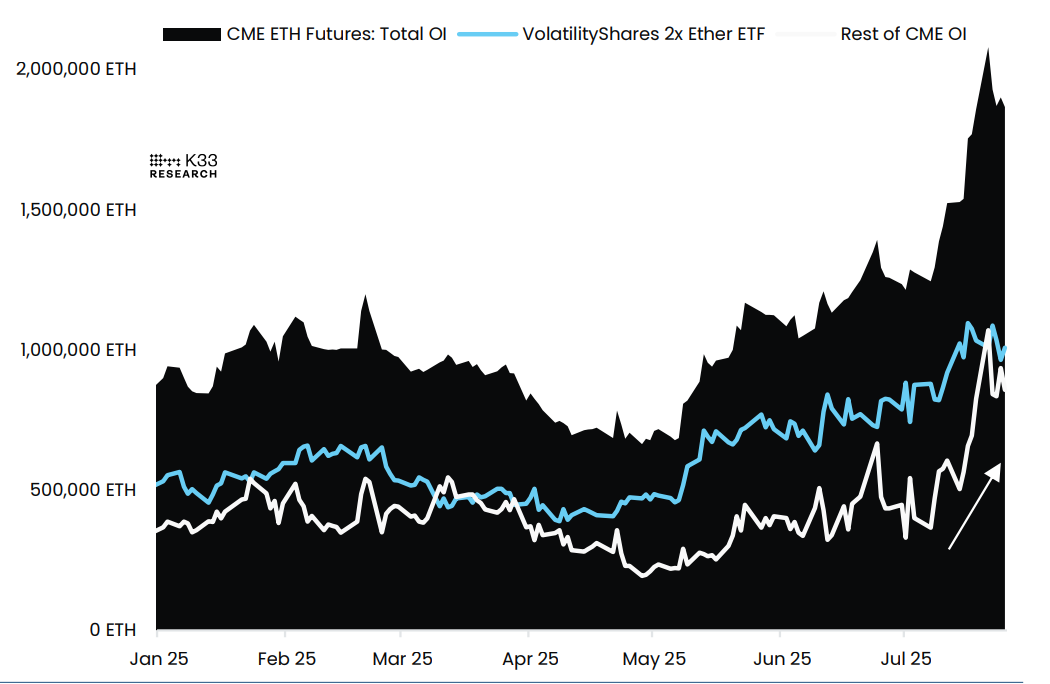
CME ETH Futures: VolatilityShares exposure vs. the rest of the CME chart Source: K33 Research
Volatile week for ETH
Traders should be cautious of a potentially volatile market for Ethereum this week, with multiple announcements expected to be released.
The US employment data release on Tuesday, followed by the Fed’s interest rate decision and a potential White House Crypto Report on Wednesday, and the approaching US President Donald Trump's tariff deadline on Friday. These news and macroeconomic conditions could bring in sharp volatility in either direction, which could trigger massive liquidation in leveraged traders across Ethereum.
Ethereum Price Forecast: ETH bulls aiming for levels above $4,000
Ethereum price retested and found support around its daily level at $3,500 on Thursday, recovering nearly 8% and closing above the daily resistance at $3,730 on Sunday. At the start of this week on Monday, ETH reached a new year-to-date high of $3,940, but faced a slight decline and retested its daily support at $3,730. At the time of writing on Tuesday, ETH rebounds, trading higher above $3,800.
If ETH continues its upward momentum, it could extend the rally toward the psychological $4,000 level.
The Relative Strength Index (RSI) on the daily chart reads 77, above its overbought level of 70, and points upward, indicating bulls still have room for a leg higher. However, the Moving Average Convergence Divergence (MACD) indicator shows that the MACD line and the signal line are converging, indicating indecisiveness among traders. Additionally, the green histogram bars are also falling, suggesting a fading of bullish momentum.
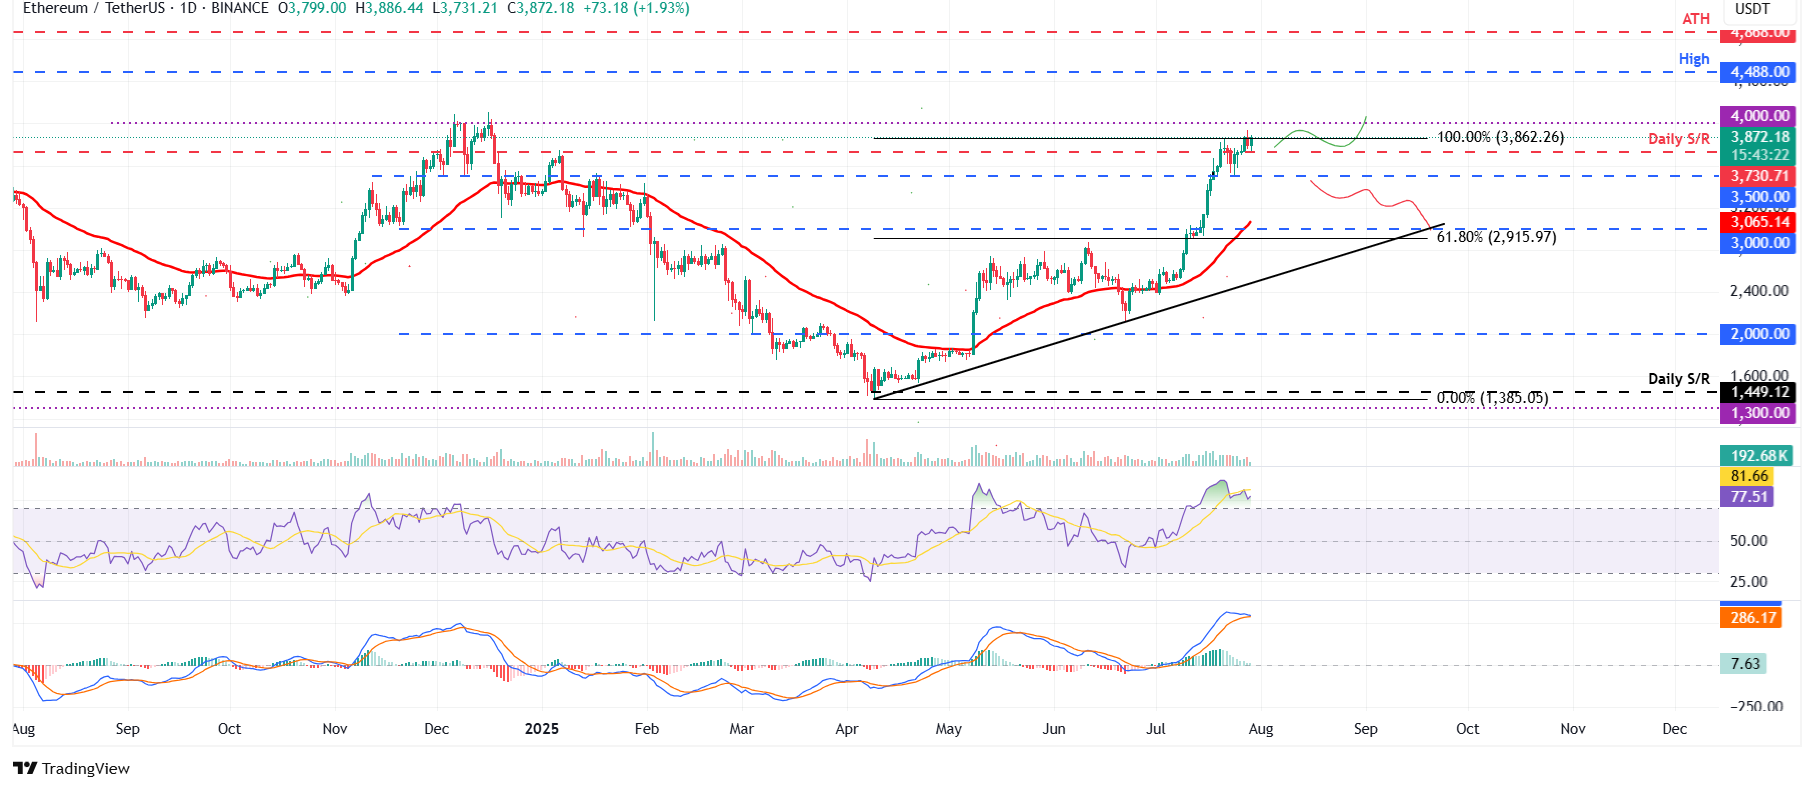
ETH/USDT daily chart
On the other hand, if ETH faces a pullback, it could extend the decline to find support around its daily level of $3,730.
Ethereum FAQs
Ethereum is a decentralized open-source blockchain with smart contracts functionality. Its native currency Ether (ETH), is the second-largest cryptocurrency and number one altcoin by market capitalization. The Ethereum network is tailored for building crypto solutions like decentralized finance (DeFi), GameFi, non-fungible tokens (NFTs), decentralized autonomous organizations (DAOs), etc.
Ethereum is a public decentralized blockchain technology, where developers can build and deploy applications that function without the need for a central authority. To make this easier, the network leverages the Solidity programming language and Ethereum virtual machine which helps developers create and launch applications with smart contract functionality.
Smart contracts are publicly verifiable codes that automates agreements between two or more parties. Basically, these codes self-execute encoded actions when predetermined conditions are met.
Staking is a process of earning yield on your idle crypto assets by locking them in a crypto protocol for a specified duration as a means of contributing to its security. Ethereum transitioned from a Proof-of-Work (PoW) to a Proof-of-Stake (PoS) consensus mechanism on September 15, 2022, in an event christened “The Merge.” The Merge was a key part of Ethereum's roadmap to achieve high-level scalability, decentralization and security while remaining sustainable. Unlike PoW, which requires the use of expensive hardware, PoS reduces the barrier of entry for validators by leveraging the use of crypto tokens as the core foundation of its consensus process.
Gas is the unit for measuring transaction fees that users pay for conducting transactions on Ethereum. During periods of network congestion, gas can be extremely high, causing validators to prioritize transactions based on their fees.
Author

Manish Chhetri
FXStreet
Manish Chhetri is a crypto specialist with over four years of experience in the cryptocurrency industry.


