- VeChain price is forming an ascending triangle pattern, hinting at a 63% upswing to $0.235.
- A decisive 6-hour candlestick close above $0.143 will signal a breakout and start of the rally.
- However, a breakdown of the swing low $0.0825 will invalidate the optimistic outlook.
VeChain price is consolidating inside a bullish technical formation that forecasts a massive uptrend. However, a breakdown of a critical support could put a dent in this rally.
VeChain price prepares for blast-off
VeChain price set up roughly three equal highs around $0.143, starting from May 19, while creating multiple higher lows. If these swing points are connected using trend lines, an ascending triangle seems to form.
This technical formation projects a 63% upswing to $0.235, determined by adding the distance between the first swing high and swing low added to the breakout point at $0.143.
Interestingly, the breakout point for VeChain price coincides with the supply zone that stretches from $0.127 to $0.142.
Hence, the bulls need extra oomph to slice through this resistance area and produce a decisive 6-hour candlestick close above $0.143. Such a move would signal a breakout from the bullish formation and the start of an uptrend for VET.
Interestingly, the target at $0.235 coincides with the lower limit of the supply zone that extends up to $0.266.
Investors should also note that the supply level at $0.187 might hinder VET’s uptrend or even halt it. Therefore, the buyers need to clear this level to hit the intended target at $0.235.
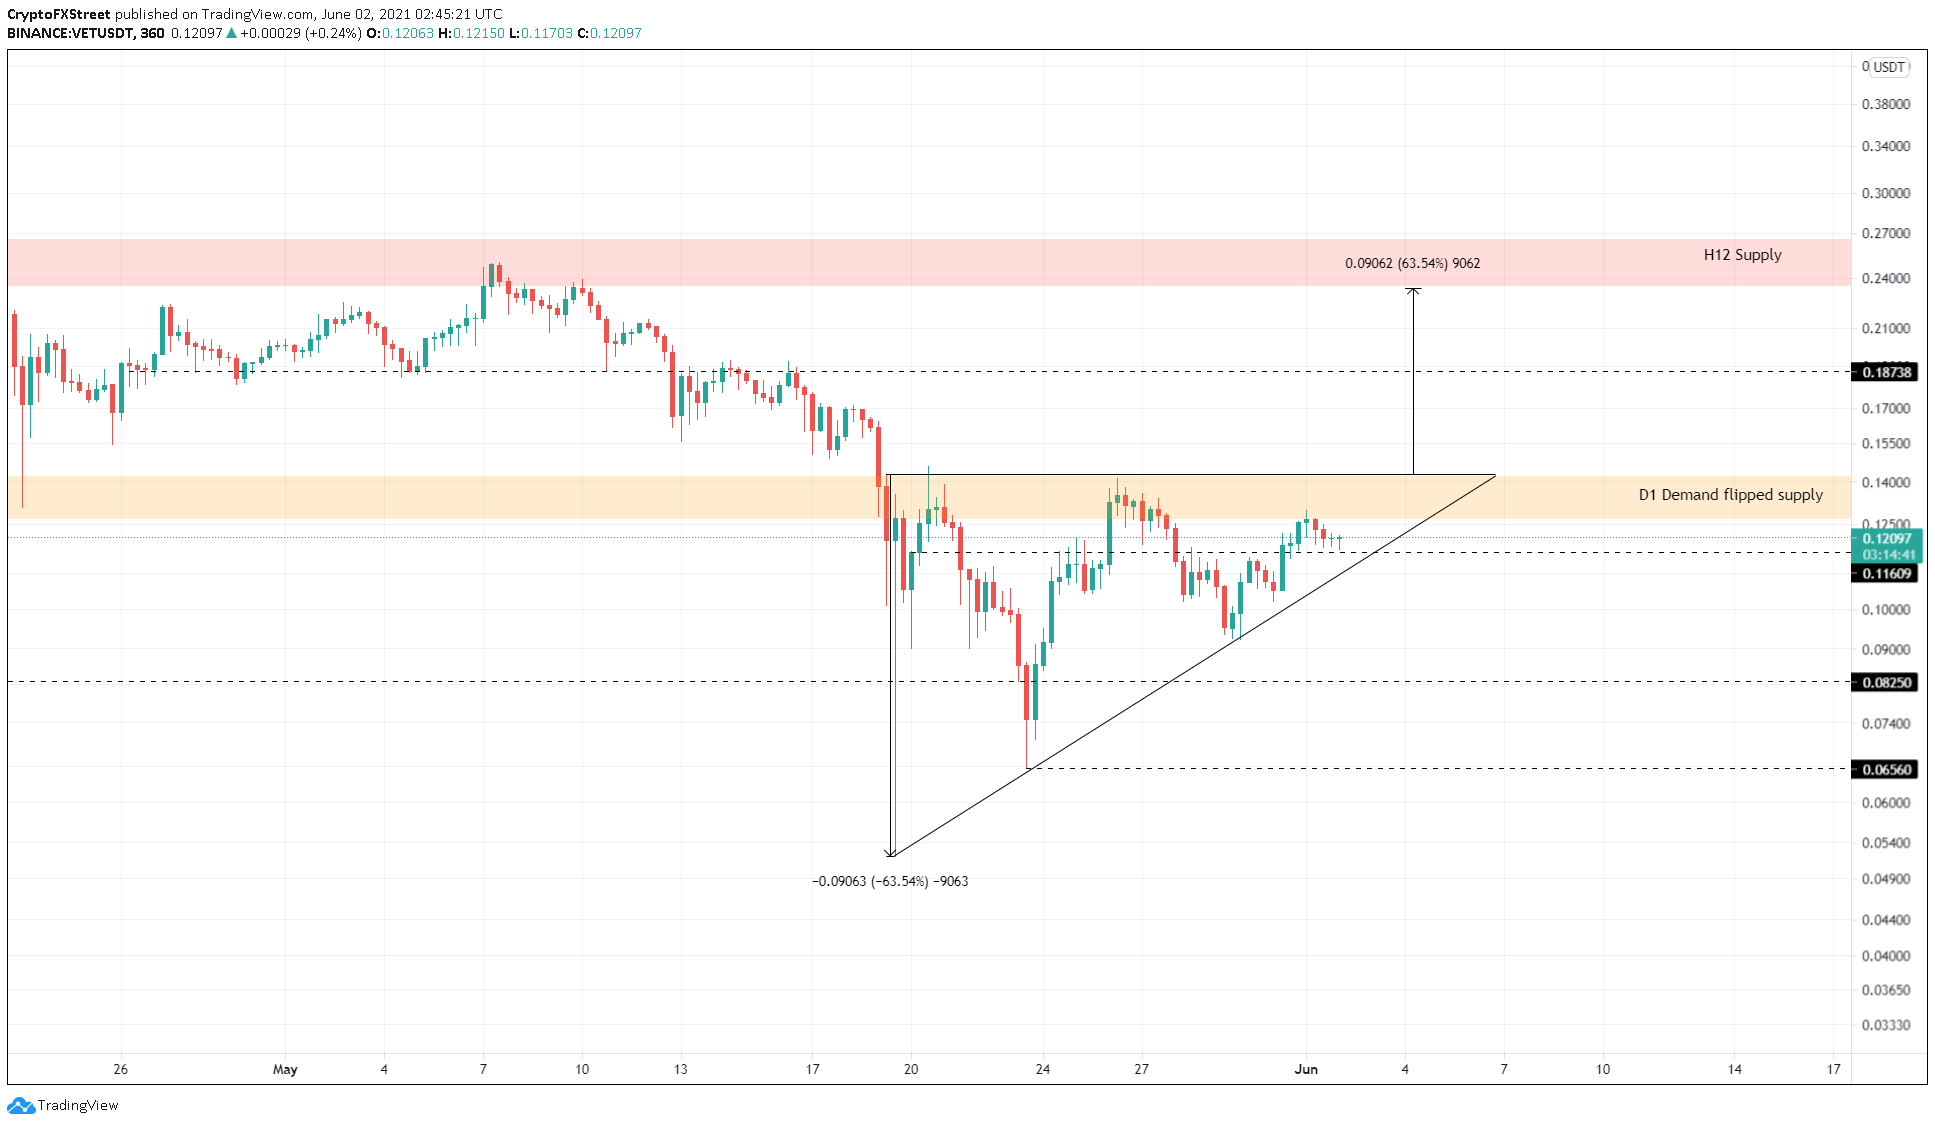
VET/USDT 6-hour chart
While things seem to be looking up for VeChin price, market participants should keep a close eye on the support barrier at $0.083. A breakdown of this level will invalidate the bullish thesis and trigger a 20% crash to $0.0656.
Information on these pages contains forward-looking statements that involve risks and uncertainties. Markets and instruments profiled on this page are for informational purposes only and should not in any way come across as a recommendation to buy or sell in these assets. You should do your own thorough research before making any investment decisions. FXStreet does not in any way guarantee that this information is free from mistakes, errors, or material misstatements. It also does not guarantee that this information is of a timely nature. Investing in Open Markets involves a great deal of risk, including the loss of all or a portion of your investment, as well as emotional distress. All risks, losses and costs associated with investing, including total loss of principal, are your responsibility. The views and opinions expressed in this article are those of the authors and do not necessarily reflect the official policy or position of FXStreet nor its advertisers. The author will not be held responsible for information that is found at the end of links posted on this page.
If not otherwise explicitly mentioned in the body of the article, at the time of writing, the author has no position in any stock mentioned in this article and no business relationship with any company mentioned. The author has not received compensation for writing this article, other than from FXStreet.
FXStreet and the author do not provide personalized recommendations. The author makes no representations as to the accuracy, completeness, or suitability of this information. FXStreet and the author will not be liable for any errors, omissions or any losses, injuries or damages arising from this information and its display or use. Errors and omissions excepted.
The author and FXStreet are not registered investment advisors and nothing in this article is intended to be investment advice.
Recommended Content
Editors’ Picks
Ripple's move above this key level could trigger nearly 50% rally for XRP
Ripple has overcome a critical resistance level and flipped into a support floor on the weekly time frame. This development happened while XRP tightly consolidated for roughly 250 days. Investors can expect XRP to kickstart a massive rally.
Optimism price outlook with nearly $90 million worth of OP tokens flooding markets on Friday
Optimism volatility has shrunk in the ours leading to the network’s cliff unlock. It joins the likes of dYdX and Sui, which have similar events on their calendars. As token unlocks are often considered bearish catalysts, investors should brace for a reaction after the event.
Top 3 Price Prediction Bitcoin, Ethereum, Ripple: Retail watches from the sidelines with a bias for shorts
Bitcoin could clear $73,777 peak as BTC bulls resurface. Ethereum might fall 10% before next leg up as ETH RSI teases with sell signal. XRP could lose $0.6000 threshold as Ripple bulls fail to show up.
Jito price could hit $6 as JTO coils up inside this bullish pattern
Jito price action shows a potential cup and handle formation. Based on theoretical measurement rules, a successful breakout could yield a 56% rally to $6.0. A breakdown of the $3.86 support level would create a lower low for JTO and invalidate the bullish thesis.
Bitcoin: BTC may have recovered, but is it out of the woods?
Bitcoin’s (BTC) upward momentum has shown a significant decline for the past two weeks or so. This development led to a bearish signal on the weekly and an uncertain outlook on the monthly.