VeChain price meltdown projects months of uncertainty for VET
- VeChain price discovers support near the 78.6% Fibonacci retracement.
- VET decline reaches 70% at the intra-day low.
- Simple ABC correction anticipated the bearish outcome.

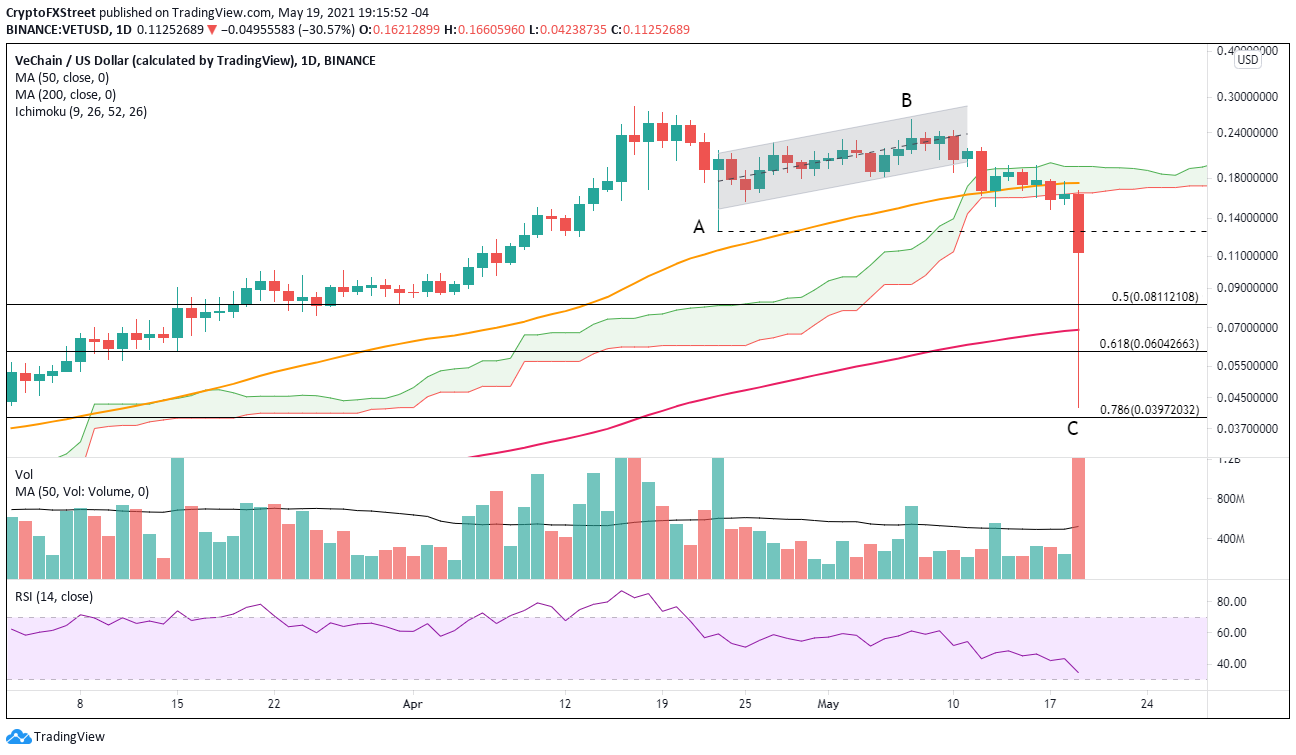
VeChain price declined 85% from the May 17 high at $0.282 to today’s intra-day low of $0.042, erasing the gains from the beginning of February. It was a radical conclusion that leaves VET in a state of uncertainty for the days and weeks ahead.
VeChain price collapse shows the downside of altcoin investing
VeChain price decline below the ascending channel on May 12 introduced a new vulnerability for VET to the oscillations of the cryptocurrency complex. For a few days, the digital token struck support at the intersection of the 50-day simple moving average (SMA) and the Ichimoku Cloud around $0.171. Still, the magnitude of today’s selling pressure shredded the support and VeChain price plummeted down near the 78.6% retracement of the 2021 rally at $0.039.
Some have directed the blame towards the sharply-worded statement by Chinese regulators regarding cryptocurrencies, but the historic decline resulted from an existing bearish pattern for VeChain price. Today represented the C leg of a simple ABC corrective pattern first highlighted in a May 13 FXStreet article. Of course, today’s decline exceeded the conservative measured move target of $0.12 for the pattern. Nevertheless, VET investors could have avoided the destruction of today.
A cryptocurrency that has declined 85% from the high will not quickly recover in the short term. The near-term resistance against the continuation of the VeChain price rebound is the April low at $0.128 and then the lower edge of the Ichimoku Cloud at $0.164, followed by the 50-day SMA at $0.174.
Any further upside before new selling would be a surprise. A test of the all-time high will not come for many months.
VET/USD daily chart
A decline of this magnitude is usually followed by selling pressures in the days following, and it will be no different for VeChain price. Unlike today, the 50% retracement of the 2021 rally at $0.081 is recognizable support for new selling pressure, but a higher probability outcome for VET will be a test of the 200-day SMA at $0.069.
Author

Sheldon McIntyre, CMT
Independent Analyst
Sheldon has 24 years of investment experience holding various positions in companies based in the United States and Chile. His core competencies include BRIC and G-10 equity markets, swing and position trading and technical analysis.