VeChain Price Prediction: VET consolidates as clear trend fails to establish
- VeChain price consolidates on the 4-hour chart, suggesting a volatile move ahead.
- The MRI indicates that the upswing is overextended as it flashed a red ‘down arrow’ candlestick.
- If sellers start booking profits, VET could revisit the 50 four-hour SMA coinciding with the demand zone’s upper barrier at $0.189.

VeChain price has been on a tear since the start of 2020 and shows no sign of slowing down despite the recent market crash. Now, VET awaits a volatile breakout from its consolidation to establish a clear trend.
VeChain price coils up
VeChain price has set up two lower highs and three higher highs since April 12. When the swing points are connected using trend lines, a symmetrical triangle pattern is formed. However, the Momentum Reversal Indicator has flashed multiple signs indicating that VeChain price rally is overextended. As of this writing, the extension B flashed in the form of a red ‘down arrow’ hints at a potential reversal.
If the market participants heed this signal and start booking profits, a breakdown of the technical formation’s lower boundary at $0.189, coinciding with the 50 Simple Moving Average (SMA) and the demand zone, could occur. Such a move would transform the SuperTrend indicator’s recently spawned buy signal into a sell sign.
Under these circumstances, VET could slide 10% toward the 61.8% Fibonacci retracement level, where the buyers could come to VeChain price’s rescue.
Adding credence to this bearish move is the SuperTrend indicator’s sell signal, which spawned immediately after the recent weekend crash.
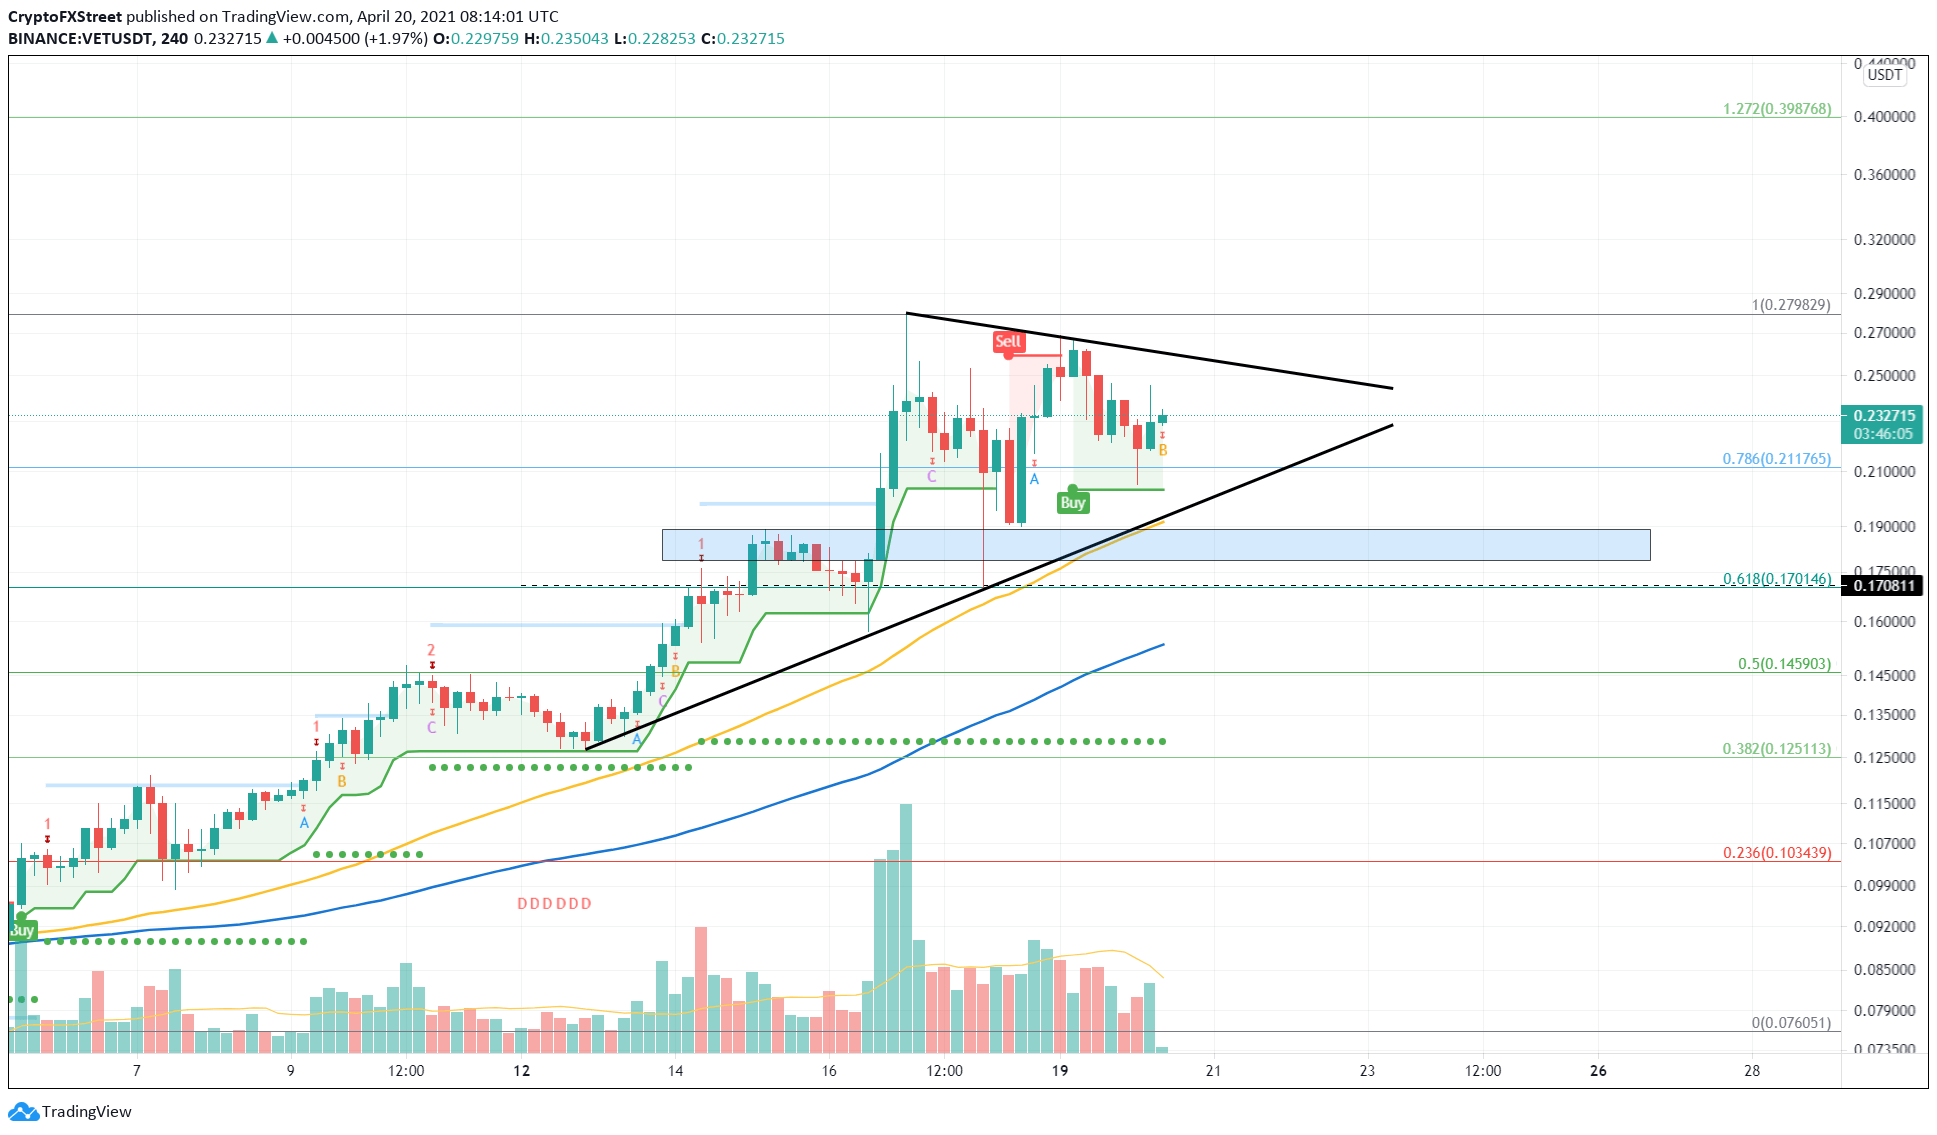
VET/USDT 4-hour chart
If the sellers fail to slice through the lower trend line of the symmetrical triangle, VeChain price could bounce off it or from the demand zone that ranges from $0.178 to $0.189.
This move would allow interested investors to buy VET at a discount. If the buying pressure increases to a level where the upper trend line at $0.258 is breached, it will trigger a second wave of buyers who could then target the recent highs at $0.279 or the 127.2% Fibonacci extension level at $0.398.
Author

Akash Girimath
FXStreet
Akash Girimath is a Mechanical Engineer interested in the chaos of the financial markets. Trying to make sense of this convoluted yet fascinating space, he switched his engineering job to become a crypto reporter and analyst.


