VeChain Price Prediction: VET shows mixed signals amid market weakness
- VeChain price has formed a bull flag on the 1-hour chart.
- The digital asset needs to climb above a key resistance level for a significant upswing.
- VET also faces selling pressure in the short term, according to multiple indicators in several time frames.

VeChain just recently formed a new all-time high of $0.189 on April 15 after a massive rally in April. The digital asset had a brief consolidation period in the last 24 hours but could be aiming for the next leg up soon.
VeChain price must climb above this key level to maintain bullish momentum
On the 1-hour chart, VeChain has formed a bull flag establishing the pole from a low of $0.13 to its all-time high at $0.189. The critical resistance level is located at $0.177. A breakout above this point has a price target of 30% at $0.232.
This target is calculated by using the height of the pole as a reference and adding it to the breakout point.
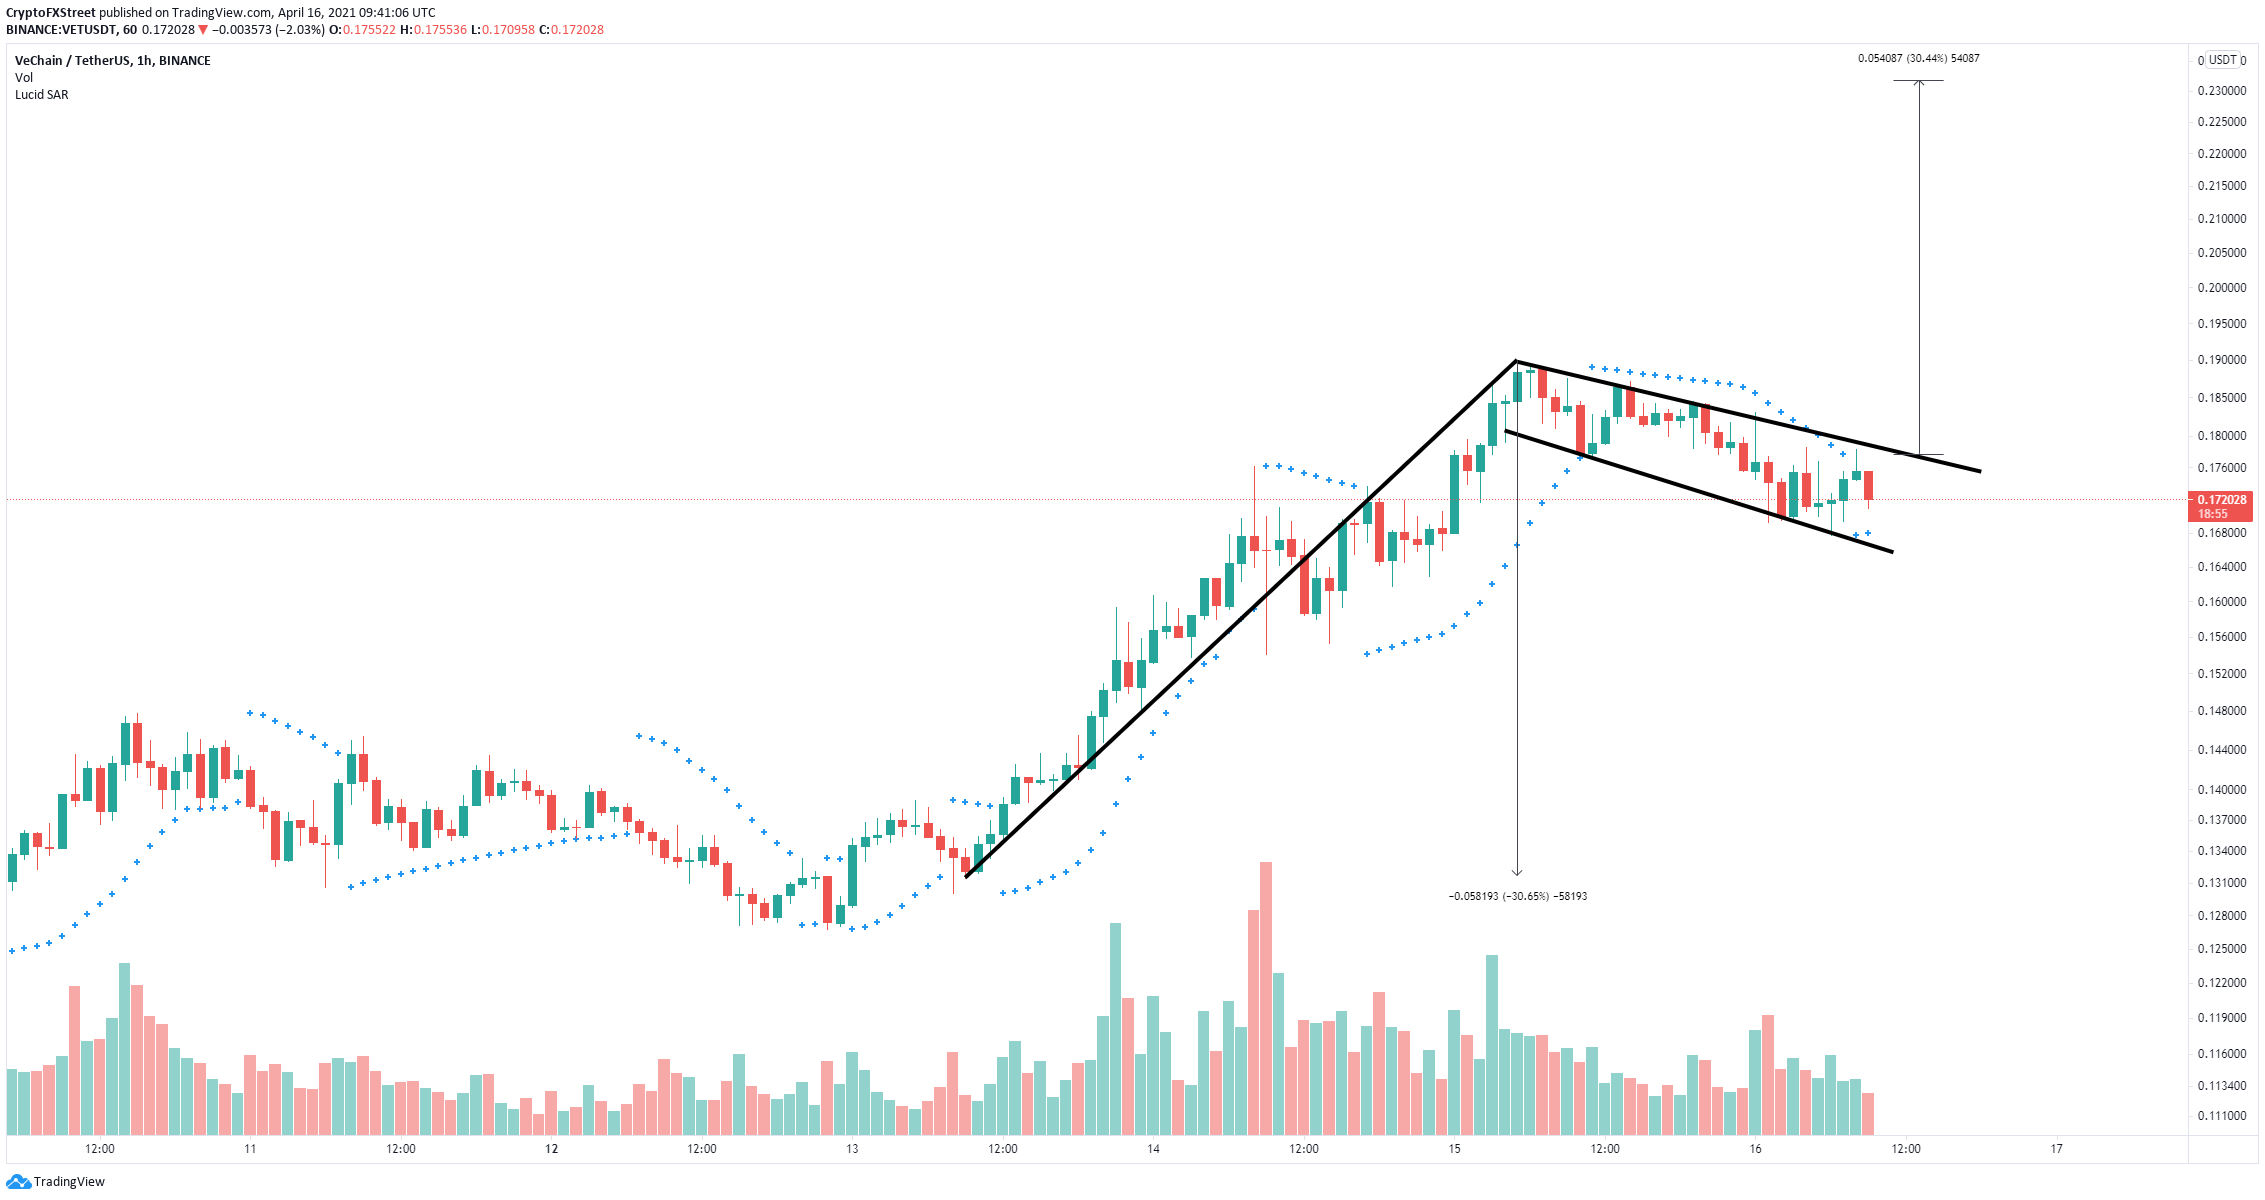
VET/USD 1-hour chart
Additionally, the Parabolic SAR, which highlights the direction an asset is moving, has just flipped bullish again, indicating that VET is ready for a rebound from the lower boundary of the flag and adding credence to the bullish outlook.
On the other hand, the TD Sequential indicator has presented a sell signal on the 9-hour chart in the form of a green '9' candlestick. The signal is getting significant continuation and can quickly push VeChain price down to $0.165 at the 78.6% Fibonacci retracement level.
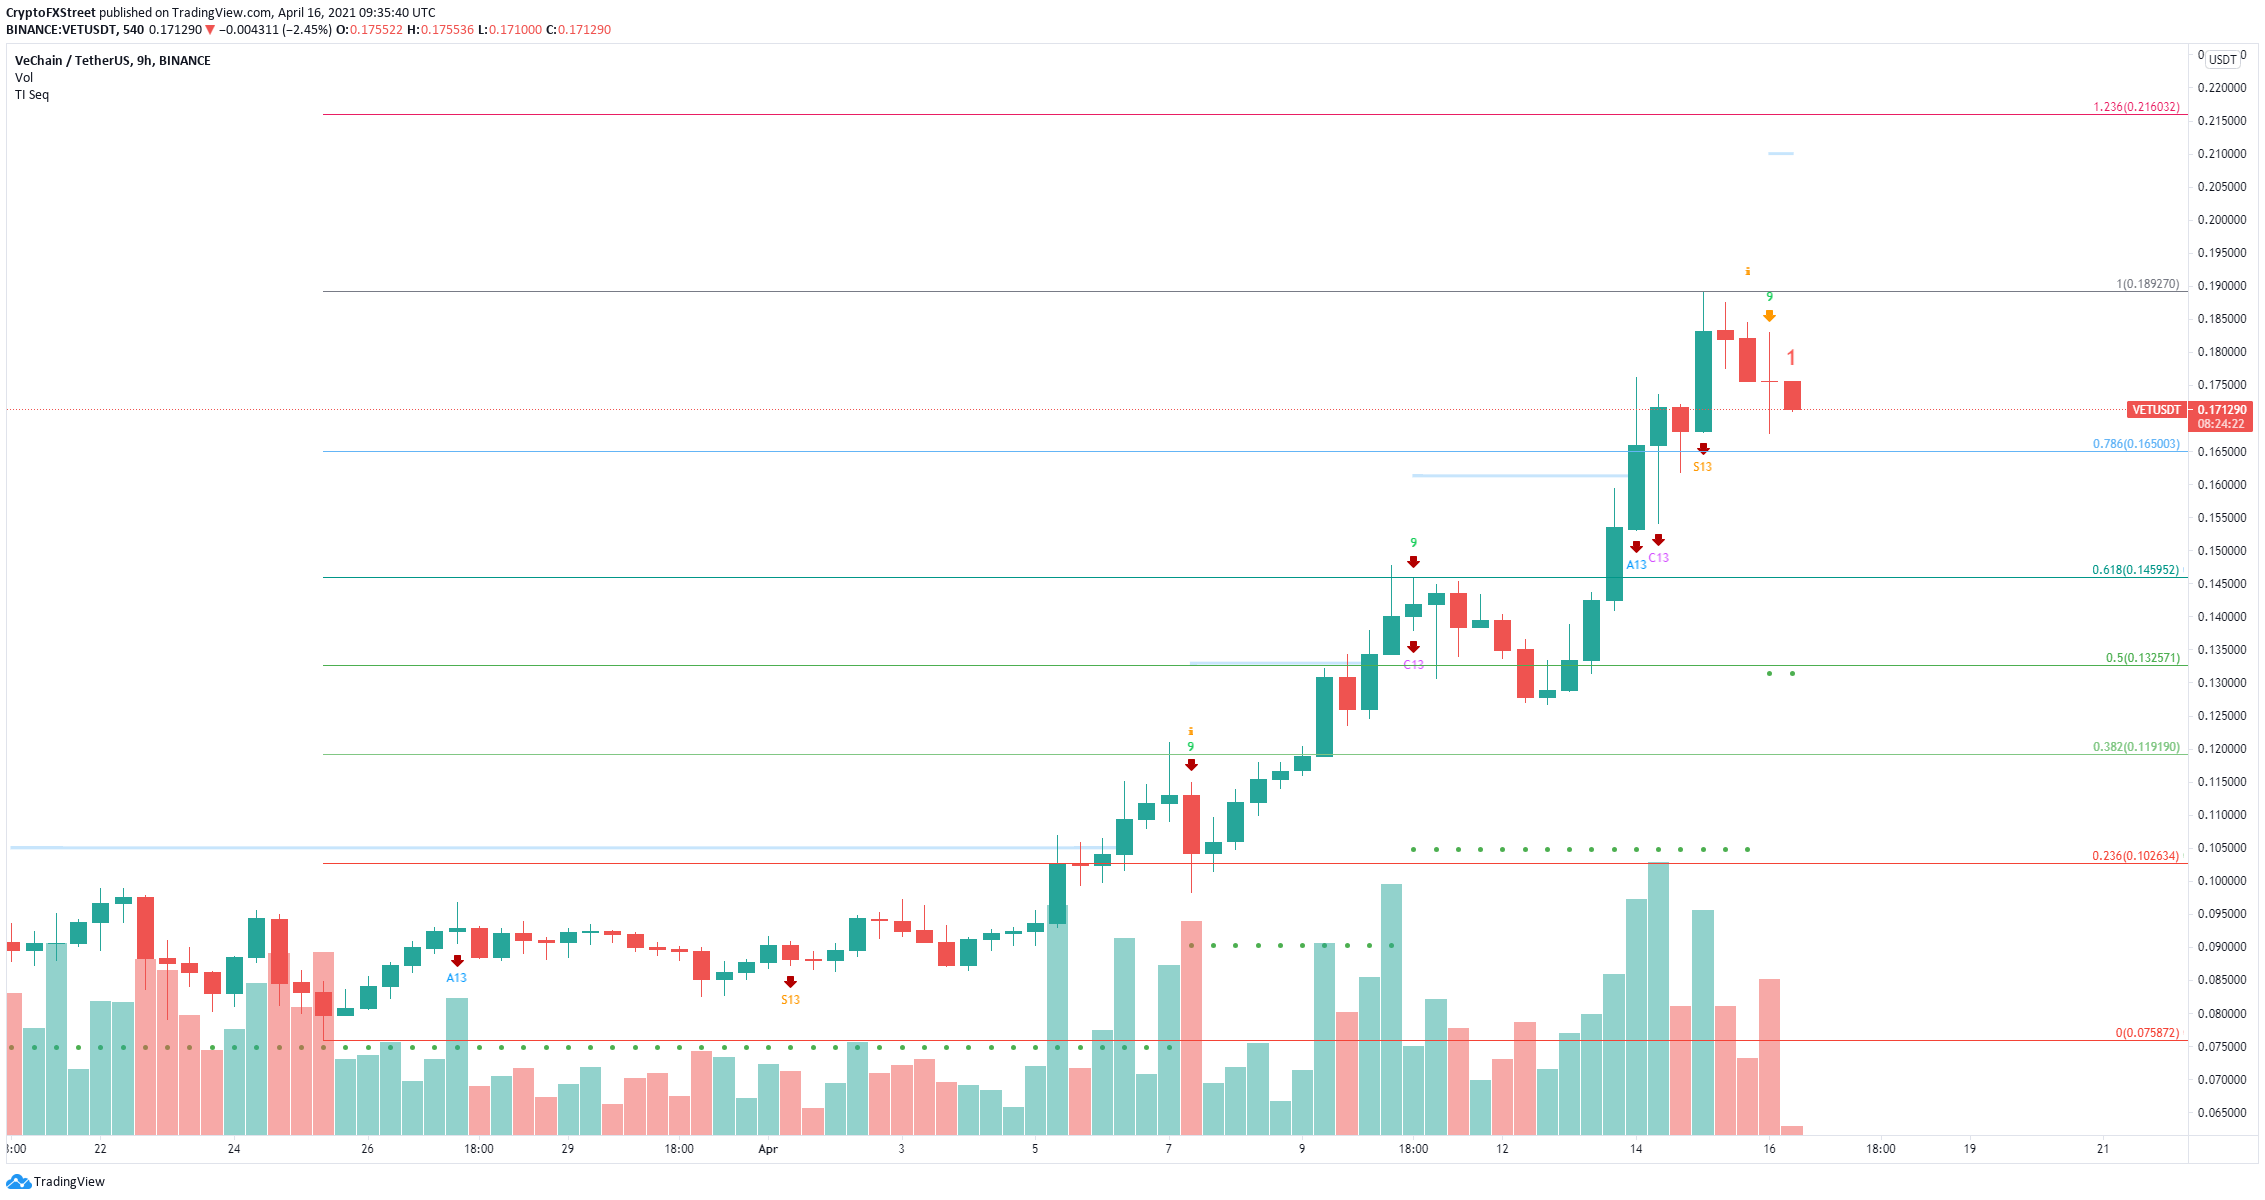
VET/USD 9-hour chart
A loss of the $0.165 support level could drive VET down to the next Fibonacci retracement level of 61.8% at $0.1459. Additionally, on the 2-day chart, a shooting star candlestick seems to be forming, which consists of a small body and long upper shadow.
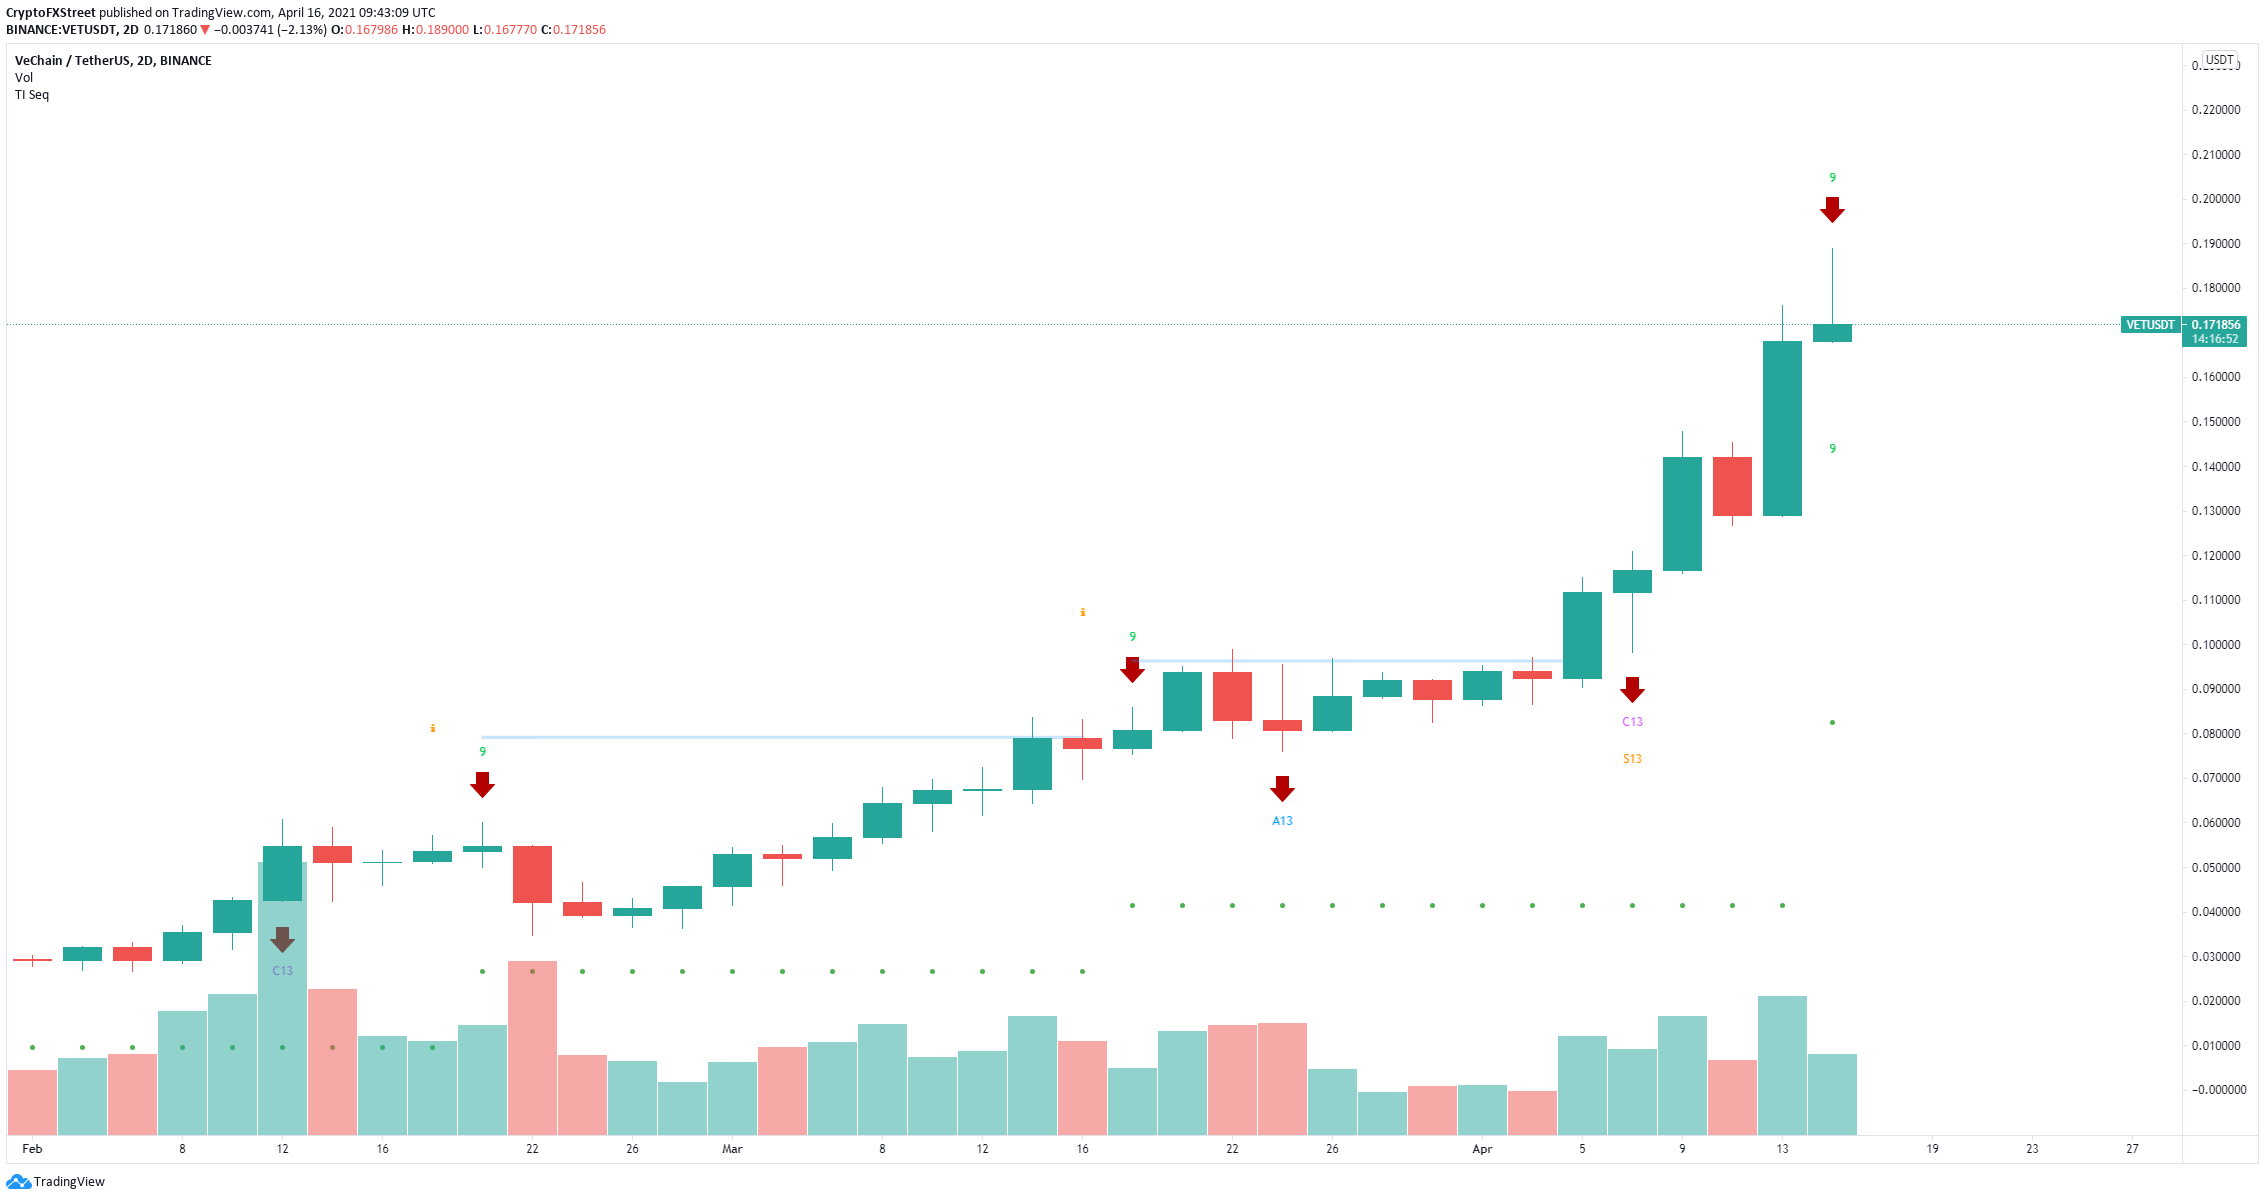
VET/USD 2-day chart
This candlestick is a bearish candlestick and indicates a potential reversal of the trend. Additionally, the TD Sequential indicator has also presented a sell signal here, further strengthening this bearish scenario.
Author

Lorenzo Stroe
Independent Analyst
Lorenzo is an experienced Technical Analyst and Content Writer who has been working in the cryptocurrency industry since 2012. He also has a passion for trading.


