VeChain Price Forecast: VET technicals spell doom as losses to $0.068 linger
- VeChain’s consolidation is likely to culminate in a colossal 21% downswing.
- VET short-term technical levels flip bearish based on RSI and MACD.
- Holding within the confines of the symmetrical pattern would avert potential breakdown to $0.068.

VeChain is down 3.6% over the last 24 hours as bulls continue to lose grip. The last few days have witnessed consolidation dominate price action. Besides, a descending trendline also limited VET’s upside. The four-hour chart highlights the formation of a symmetrical triangle pattern, with a 21% breakdown target.
VeChain faces rising selling pressure
The Moving Average Convergence Divergence (MACD) indicator on the 4-hour chart has slipped into the negative region. In addition, the MACD line (blue) recently crossed below the signal line. This technical indicator validates the bearish outlook.
The same four-hour chart illustrates the formation of a symmetrical triangle. This pattern is not exclusively bullish or bearish. It brings to light a consolidation period before an upswing or downswing comes into the picture.
Two converging trend lines create a symmetrical triangle. Following the consolidation, a breakdown occurs when the price slices through the lower trend line and marks the start of a downtrend. For instance, VeChain is likely to drop by 21% to $0.068 if the price slips under the ascending line.
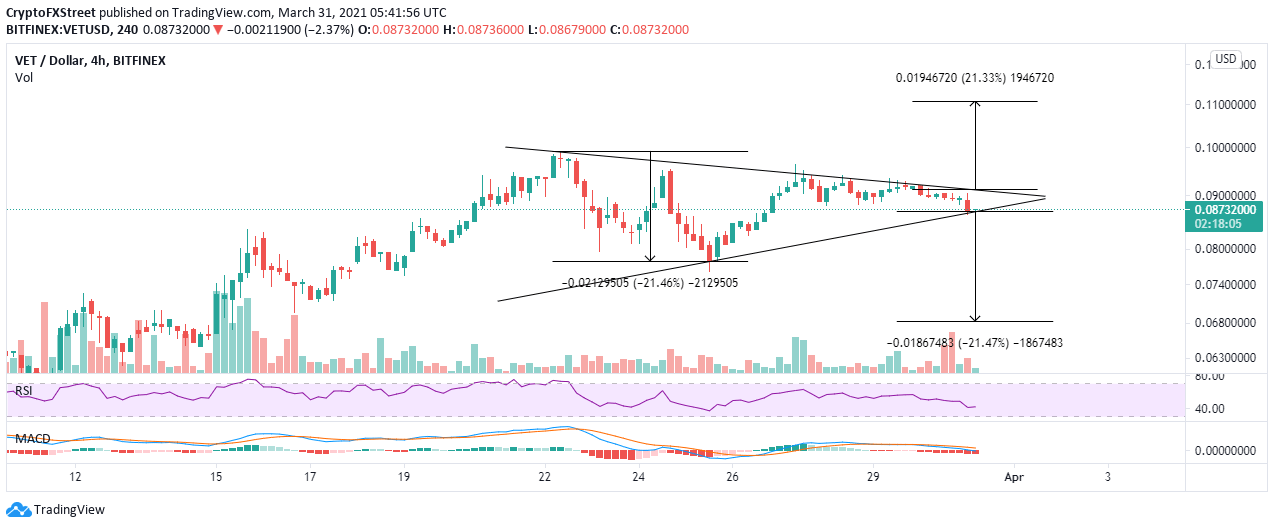
VET/USD 4-hour chart
Looking at the other side of the picture
The TD Sequential indicator is likely to present a buy signal on the 4-hour chart. This call to buy in would form in a red nine candlestick. The red candle suggests that bears are losing grip as buyers prepare to take control. If validated, VeChain may swing higher in one to four candlesticks on the same chart.
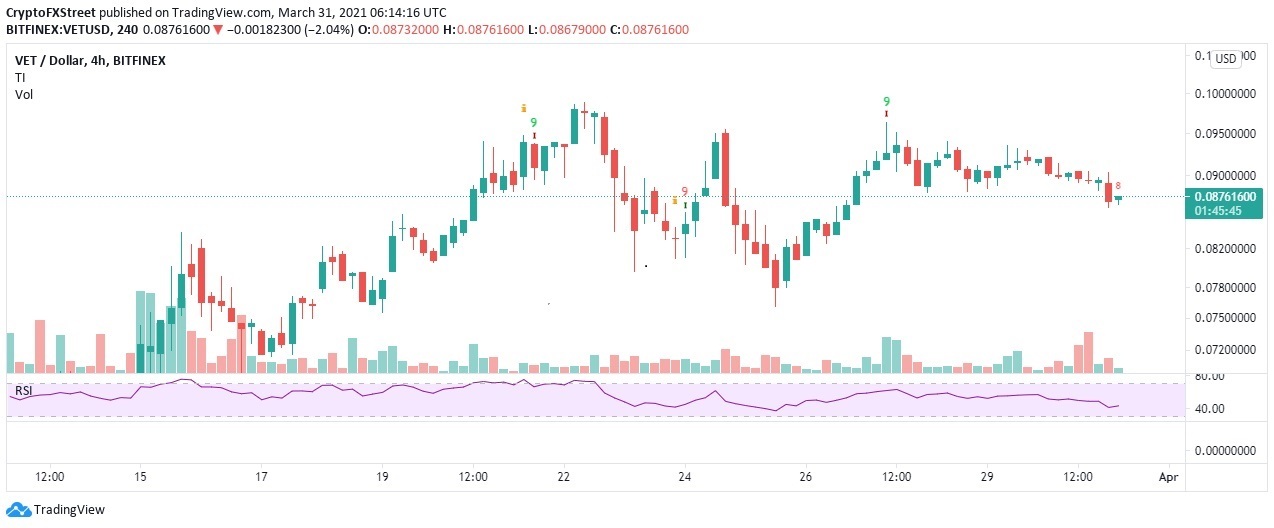
VET/USD 4-hour chart
It is worth mentioning that the Relative Strength Index (RSI) on the 4-hour chart hints at the sideways trading lasting longer. Moreover, a rebound from the support at 40 would encourage investors to increase their stakes as speculation mounts for VET’s upswing above the symmetrical triangle. The technical pattern has a 21% breakout target close to $0.11.
Author

John Isige
FXStreet
John Isige is a seasoned cryptocurrency journalist and markets analyst committed to delivering high-quality, actionable insights tailored to traders, investors, and crypto enthusiasts. He enjoys deep dives into emerging Web3 tren


