|

VeChain Price Forecast: VET extends climb toward $0.1000 following technical correction

  • VET turned north after dropping to 20-day SMA earlier in the week.
  • $0.1000 aligns as the initial target on the upside.
  • The RSI indicator on the daily chart shows VET is about to become overbought.

VeChain price started the new week on the back foot and lost more than 13% before reversing the course on Friday. Following an impressive 11% rebound, VET preserved its bullish momentum on Saturday and was last seen gaining 6.6% on a daily basis at $0.09590.

VET could struggle to break above $0.1000

On the upside, the first resistance is located at $0.1000 (psychological level). On Monday, VET lost its traction after approaching this level as the Relative Strength Index (RSI) indicator on the daily chart rose above 70 to show overbought conditions.

Currently, the RSI is floating a little below 70, suggesting that the price could have a tough time pushing higher even if it manages to reach $0.1000 and make a correction before the next leg up. Above that level, the upper limit of the ascending channel coming from March 1 forms the next hurdle at $0.1050.

On the other hand, the first support could be seen at $0.0850 (lower limit of the ascending channel) ahead of $0.0777 (20-day SMA). A daily close below the latter could trigger a technical selloff and cause a bearish shift in the near-term technical outlook.
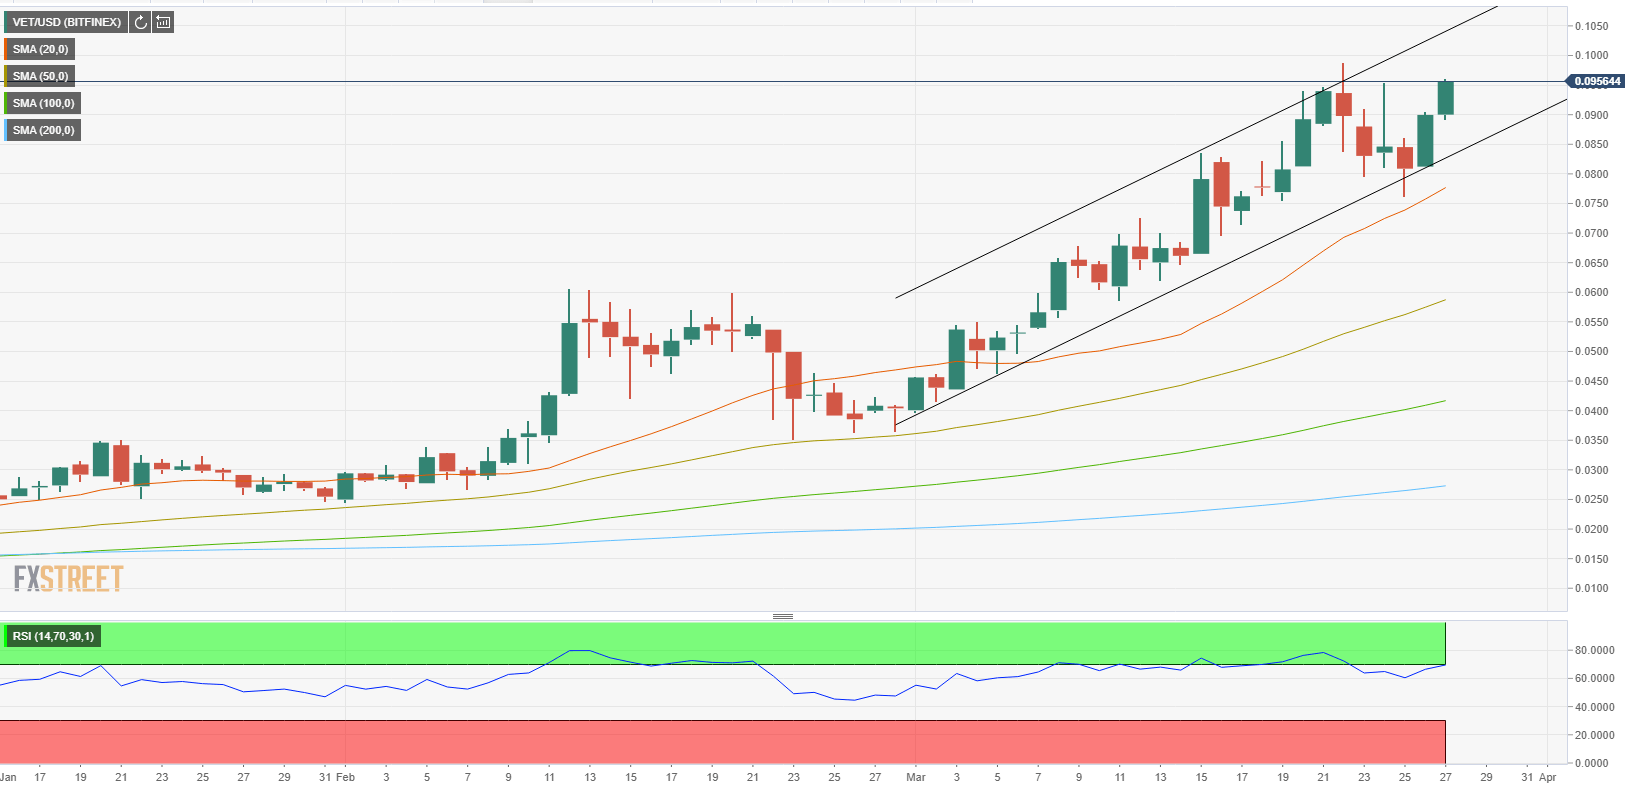
VeChain one-day chart

The ongoing rebound suggests that sellers are struggling to dominate VeChain's price action. However, the technical picture suggests that another downward correction is possible before VET aims for new highs above $0.1000.

Author

Eren Sengezer

As an economist at heart, Eren Sengezer specializes in the assessment of the short-term and long-term impacts of macroeconomic data, central bank policies and political developments on financial assets.


More from Eren Sengezer
Share:

Editor's Picks

Cardano Price Forecast: Approaches critical support as correction risks grow
Cardano (ADA) recovers slightly, trading at $0.206 at the time of writing on Friday, inches above the critical support zone after losing more than 6% so far this week. Weakening derivatives data and fading bullish momentum suggest a bearish near-term outlook, with a decisive close below the support zone potentially triggering a deeper correction for ADA.
Crypto Overview: Bitcoin slips below $77,000 – Raydium, Falcon Finance hold gains

Bitcoin price trades below $77,000 on Friday, extending its capitulation from the previous week’s high at $82,300. Broader market consensus points to a higher likelihood that the US Federal Reserve could raise interest rates at the September meeting, as inflation concerns rise amid the war with Iran.

Top 3 Price Prediction: Bitcoin, Ethereum, Ripple – BTC pullback, ETH stalls, XRP weakens
Bitcoin (BTC), Ethereum (ETH) and Ripple (XRP) remain under pressure on Friday as the broader cryptocurrency market extends its losses over 4%, 2.5% and 5%, respectively, this week.
Ethereum Price Forecast: ETH holds above $2,400 as PPI data strengthens rate hike expectations
Ethereum (ETH) is down 0.7% on Thursday as the second-largest cryptocurrency looks to recover from earlier pressure following the release of stronger US inflation data. The Producer Price Index (PPI) for final demand rose 0.4% in August, matching market expectations after a revised 0.1% increase in July, according to the US Labor Department.
Bitcoin: Gearing up for a sharp move
Bitcoin (BTC) is trading around $81,000 on Friday, up over 4% so far this week, and awaits a key catalyst that could determine its next directional move. Strong institutional demand is supporting the bullish price action, with spot BTC Exchange Traded Funds (ETFs) on track to record a third straight week of inflows.

