- VeChain is hanging at the edge of a cliff following a 30% drop from the highs reached in November.
- Continued bearish action under the 50 SMA could see VET retest support at the 50 SMA and 200 SMA.
VeChain has retraced 30% from the highs recently achieved in November. VET appears to have taken a pit stop at $0.013, but it struggles to sustain the uptrend. More declines are likely to come into the picture, mostly if the token fails to close the day above $0.014.
VeChain downtrend hits a temporary pause
VET/USD is holding the ground slightly above the 50 Simple Moving Average. Following the slump from $0.018, buyers seem to have retreated into the sidelines until a breakout is confirmed. Meanwhile, if losses resume under the moving average support, the downtrend could extend first to the 100 SMA and perhaps 200 SMA on the 4-hour chart.
VET/USD 4-hour chart
The TD Sequential indicator has presented a couple of sell signals on the 12-hour and the daily charts. The signals formed in green nine candlesticks, which validated the slide from the monthly peak. The price action is likely to occur in one to four daily candlesticks.
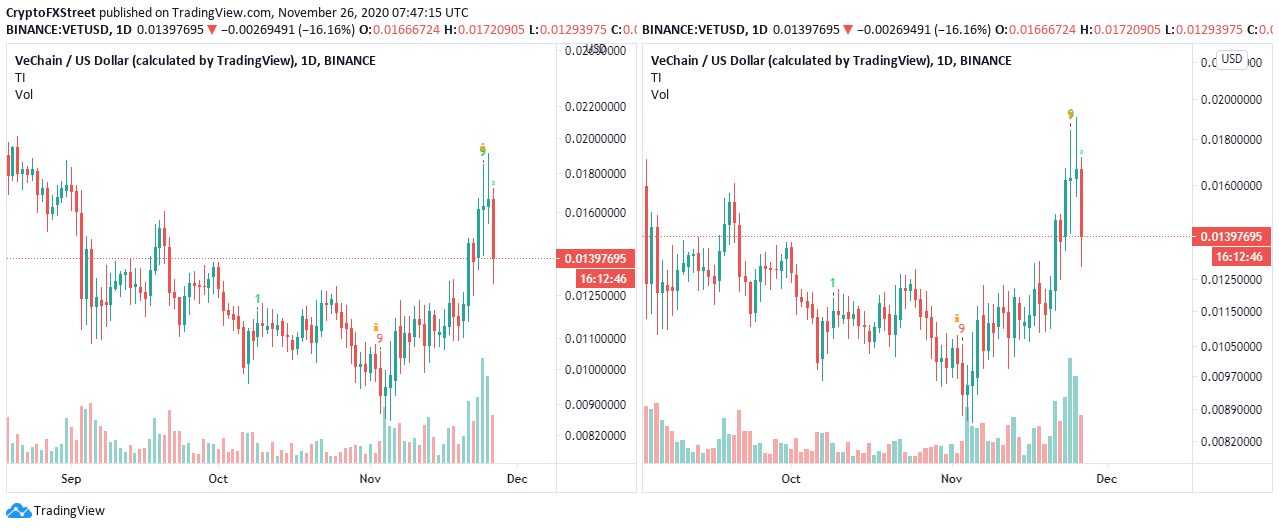
VET/USD 12-hour and daily charts
IntoTheBlock's "New Daily Addresses" metric shows a recent decrease in the number of new addresses joining the VeChain network. A fall in the new addresses created on the network is usually a bearish signal. Therefore, VET is likely to maintain the downtrend, mainly because the token's inflow and outflow are negatively affected.
VeChain new addresses chart
It is worth mentioning that VeChain will resume the uptrend if the price closed the day above the 50 SMA on the 4-hour chart. Moreover, trading above $0.014 might give bulls a sense of stability and a chance to plan the next move towards $0.02.
Information on these pages contains forward-looking statements that involve risks and uncertainties. Markets and instruments profiled on this page are for informational purposes only and should not in any way come across as a recommendation to buy or sell in these assets. You should do your own thorough research before making any investment decisions. FXStreet does not in any way guarantee that this information is free from mistakes, errors, or material misstatements. It also does not guarantee that this information is of a timely nature. Investing in Open Markets involves a great deal of risk, including the loss of all or a portion of your investment, as well as emotional distress. All risks, losses and costs associated with investing, including total loss of principal, are your responsibility. The views and opinions expressed in this article are those of the authors and do not necessarily reflect the official policy or position of FXStreet nor its advertisers. The author will not be held responsible for information that is found at the end of links posted on this page.
If not otherwise explicitly mentioned in the body of the article, at the time of writing, the author has no position in any stock mentioned in this article and no business relationship with any company mentioned. The author has not received compensation for writing this article, other than from FXStreet.
FXStreet and the author do not provide personalized recommendations. The author makes no representations as to the accuracy, completeness, or suitability of this information. FXStreet and the author will not be liable for any errors, omissions or any losses, injuries or damages arising from this information and its display or use. Errors and omissions excepted.
The author and FXStreet are not registered investment advisors and nothing in this article is intended to be investment advice.
Recommended Content
Editors’ Picks
Ripple's move above this key level could trigger nearly 50% rally for XRP
Ripple has overcome a critical resistance level and flipped into a support floor on the weekly time frame. This development happened while XRP tightly consolidated for roughly 250 days. Investors can expect XRP to kickstart a massive rally.
Optimism price outlook with nearly $90 million worth of OP tokens flooding markets on Friday
Optimism volatility has shrunk in the ours leading to the network’s cliff unlock. It joins the likes of dYdX and Sui, which have similar events on their calendars. As token unlocks are often considered bearish catalysts, investors should brace for a reaction after the event.
Top 3 Price Prediction Bitcoin, Ethereum, Ripple: Retail watches from the sidelines with a bias for shorts
Bitcoin could clear $73,777 peak as BTC bulls resurface. Ethereum might fall 10% before next leg up as ETH RSI teases with sell signal. XRP could lose $0.6000 threshold as Ripple bulls fail to show up.
Jito price could hit $6 as JTO coils up inside this bullish pattern
Jito price action shows a potential cup and handle formation. Based on theoretical measurement rules, a successful breakout could yield a 56% rally to $6.0. A breakdown of the $3.86 support level would create a lower low for JTO and invalidate the bullish thesis.
Bitcoin: BTC may have recovered, but is it out of the woods?
Bitcoin’s (BTC) upward momentum has shown a significant decline for the past two weeks or so. This development led to a bearish signal on the weekly and an uncertain outlook on the monthly.