Vechain price has the potential to see a 3% rise if this critical barrier is broken
- Vechain price is contained inside an ascending parallel channel formed on the hourly chart.
- Several indicators are showing Vechain is close to a breakout.

Vechain had a massive 14% price pump on November 9 hitting a high of $0.0118 and establishing an ascending parallel channel shortly after. The most critical resistance level is the upper boundary of this pattern.
Vechain price has to crack $0.0117 for a 3% increase
On the hourly chart, Vechain price has established an ascending parallel channel with the upper boundary at $0.0117. A breakout above this point can drive VET towards $0.0121, a 3% price increase using the height of the pattern.
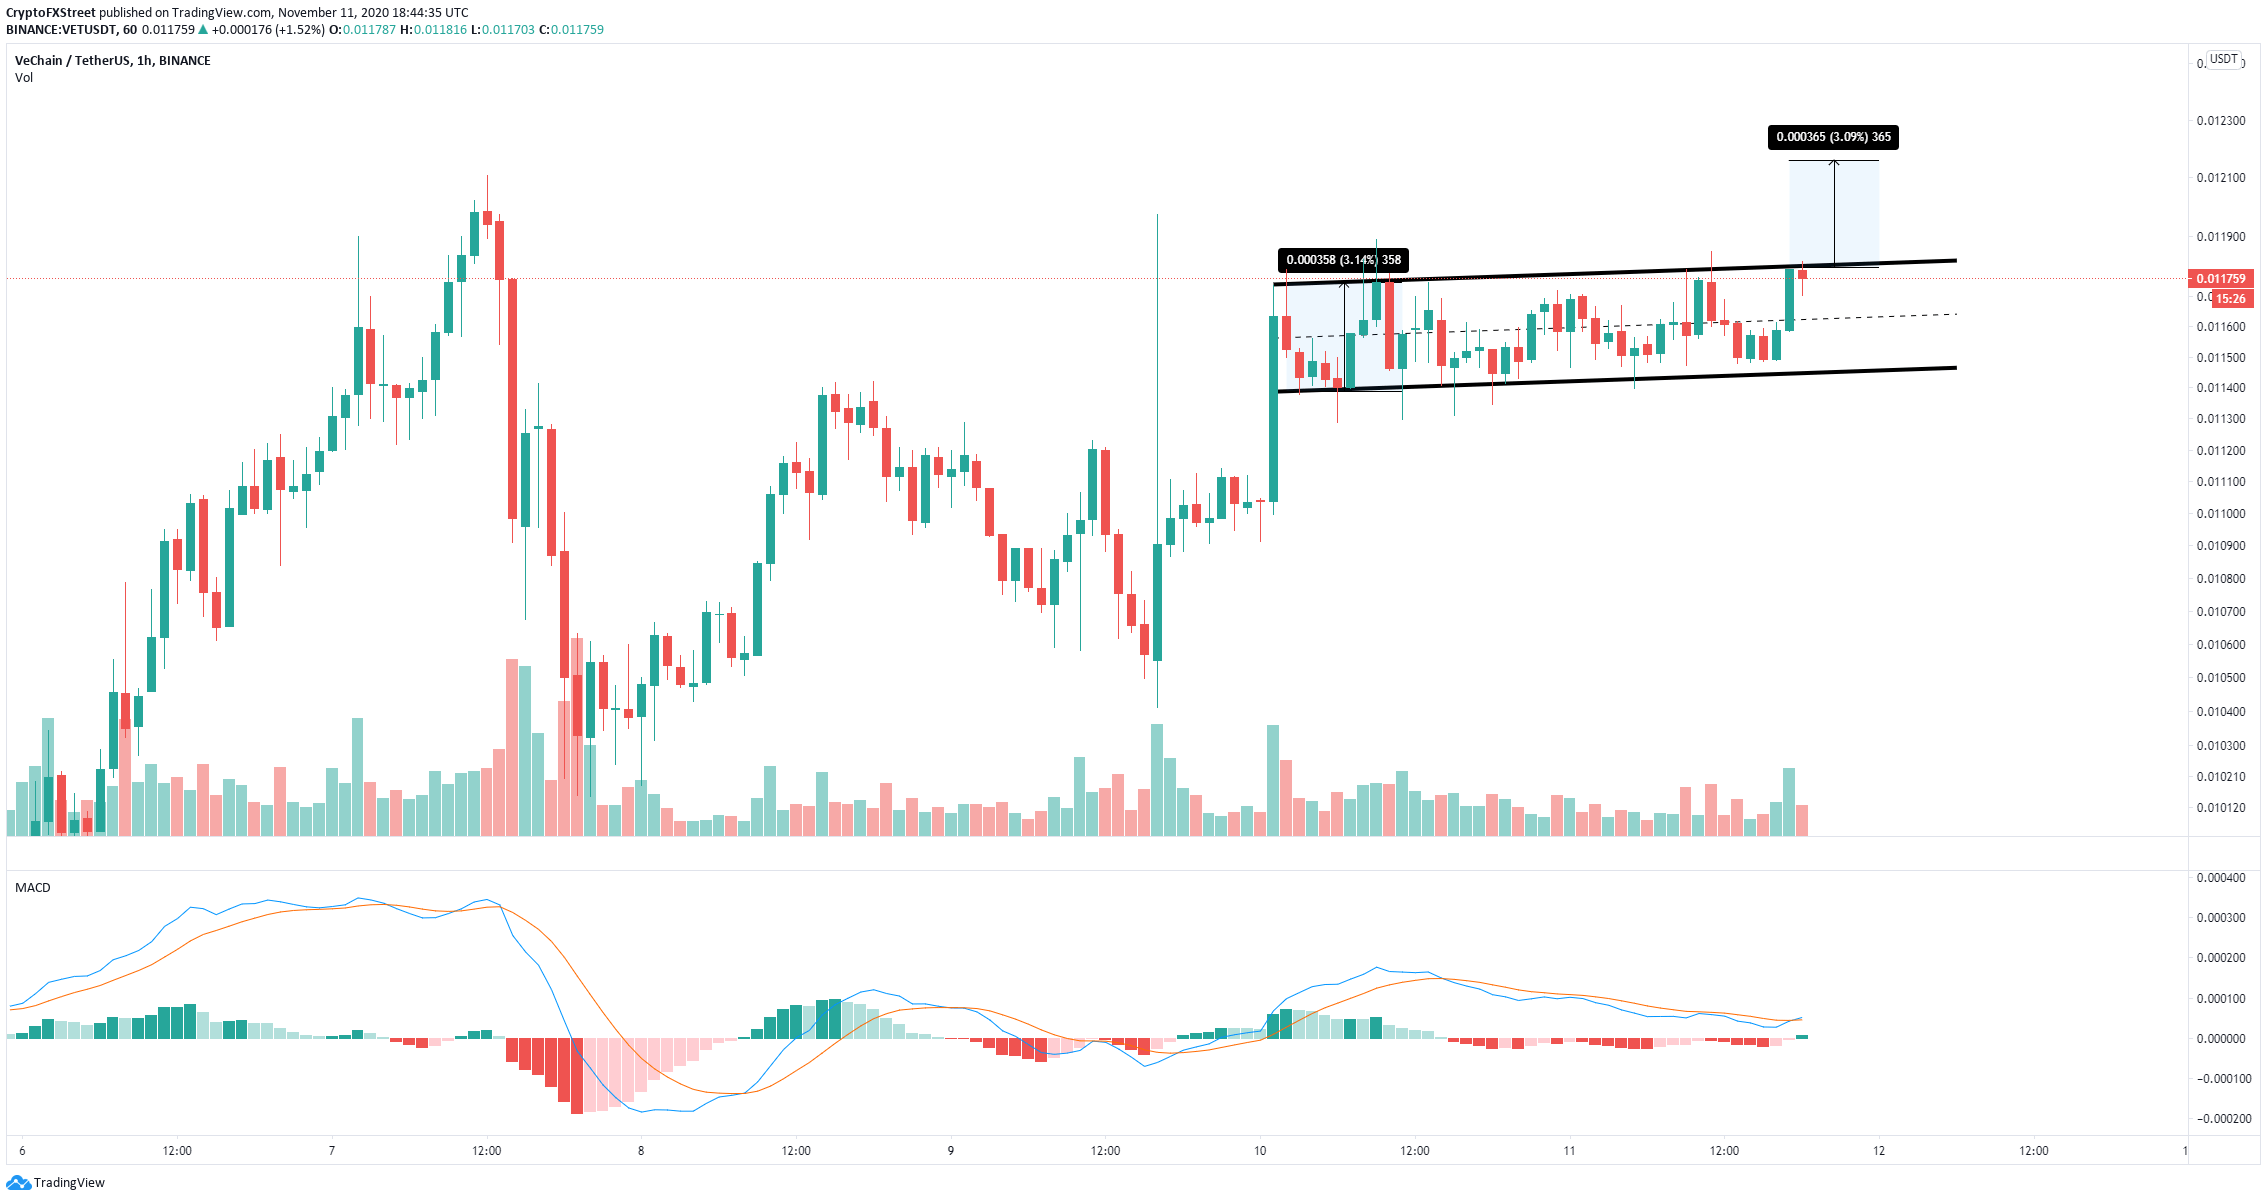
VET/USD 1-hour chart
Additionally, the MACD has turned bullish for the first time since November 9 which was followed by a 12% move. Bollinger Bands have squeezed significantly, another indicator that a breakout is nearby.
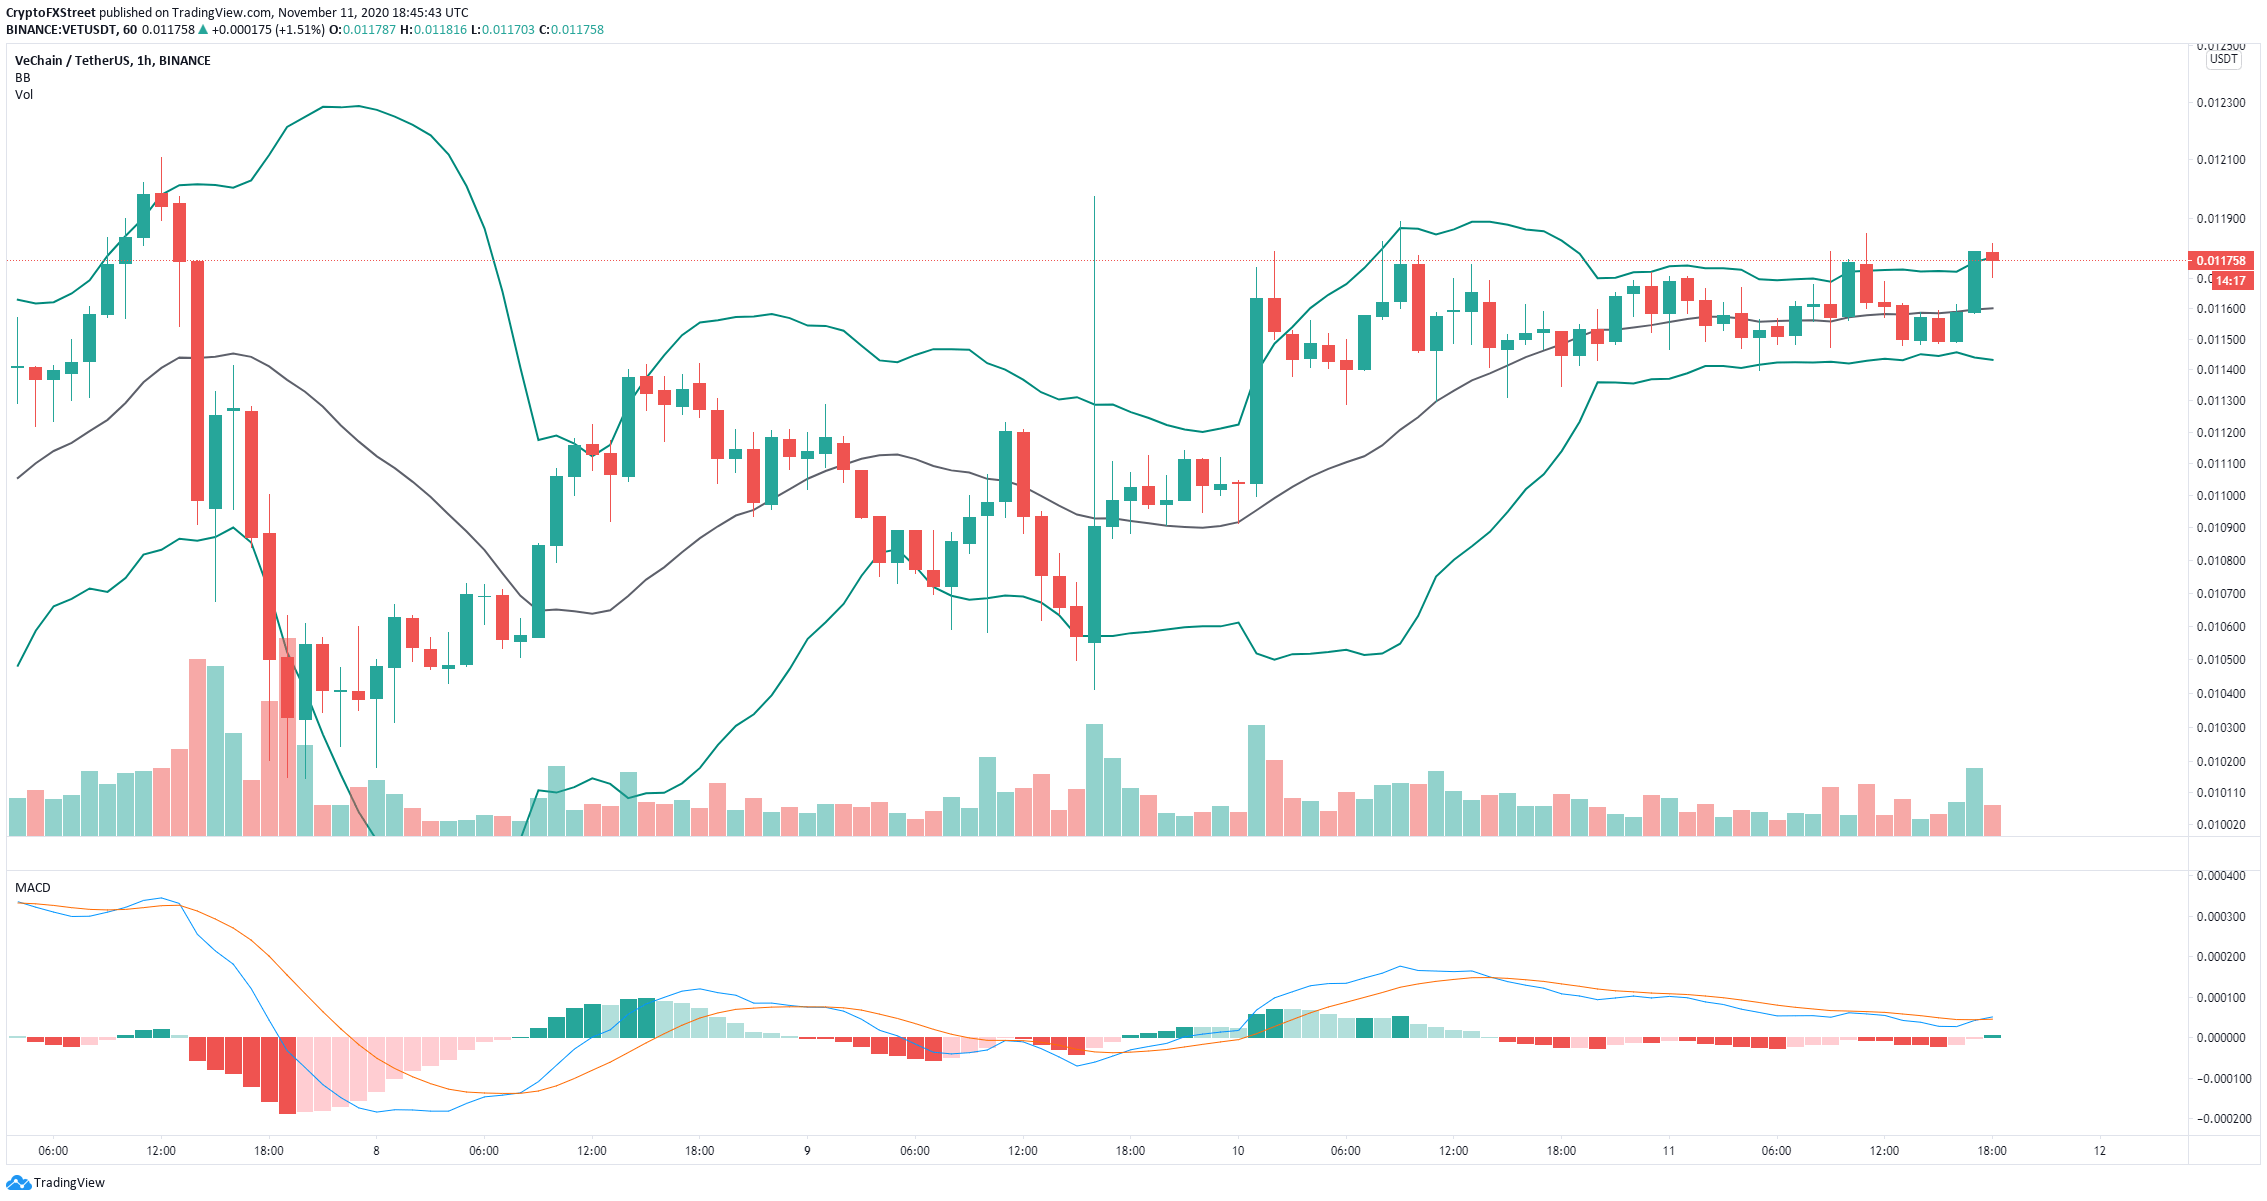
VET/USD 1-hour chart
Despite the potential breakout of Vechain, the digital asset faces a robust resistance level at $0.0117 which coincides with the 200-SMA on the daily chart. VET also seems to be contained inside a descending parallel channel on the daily chart.
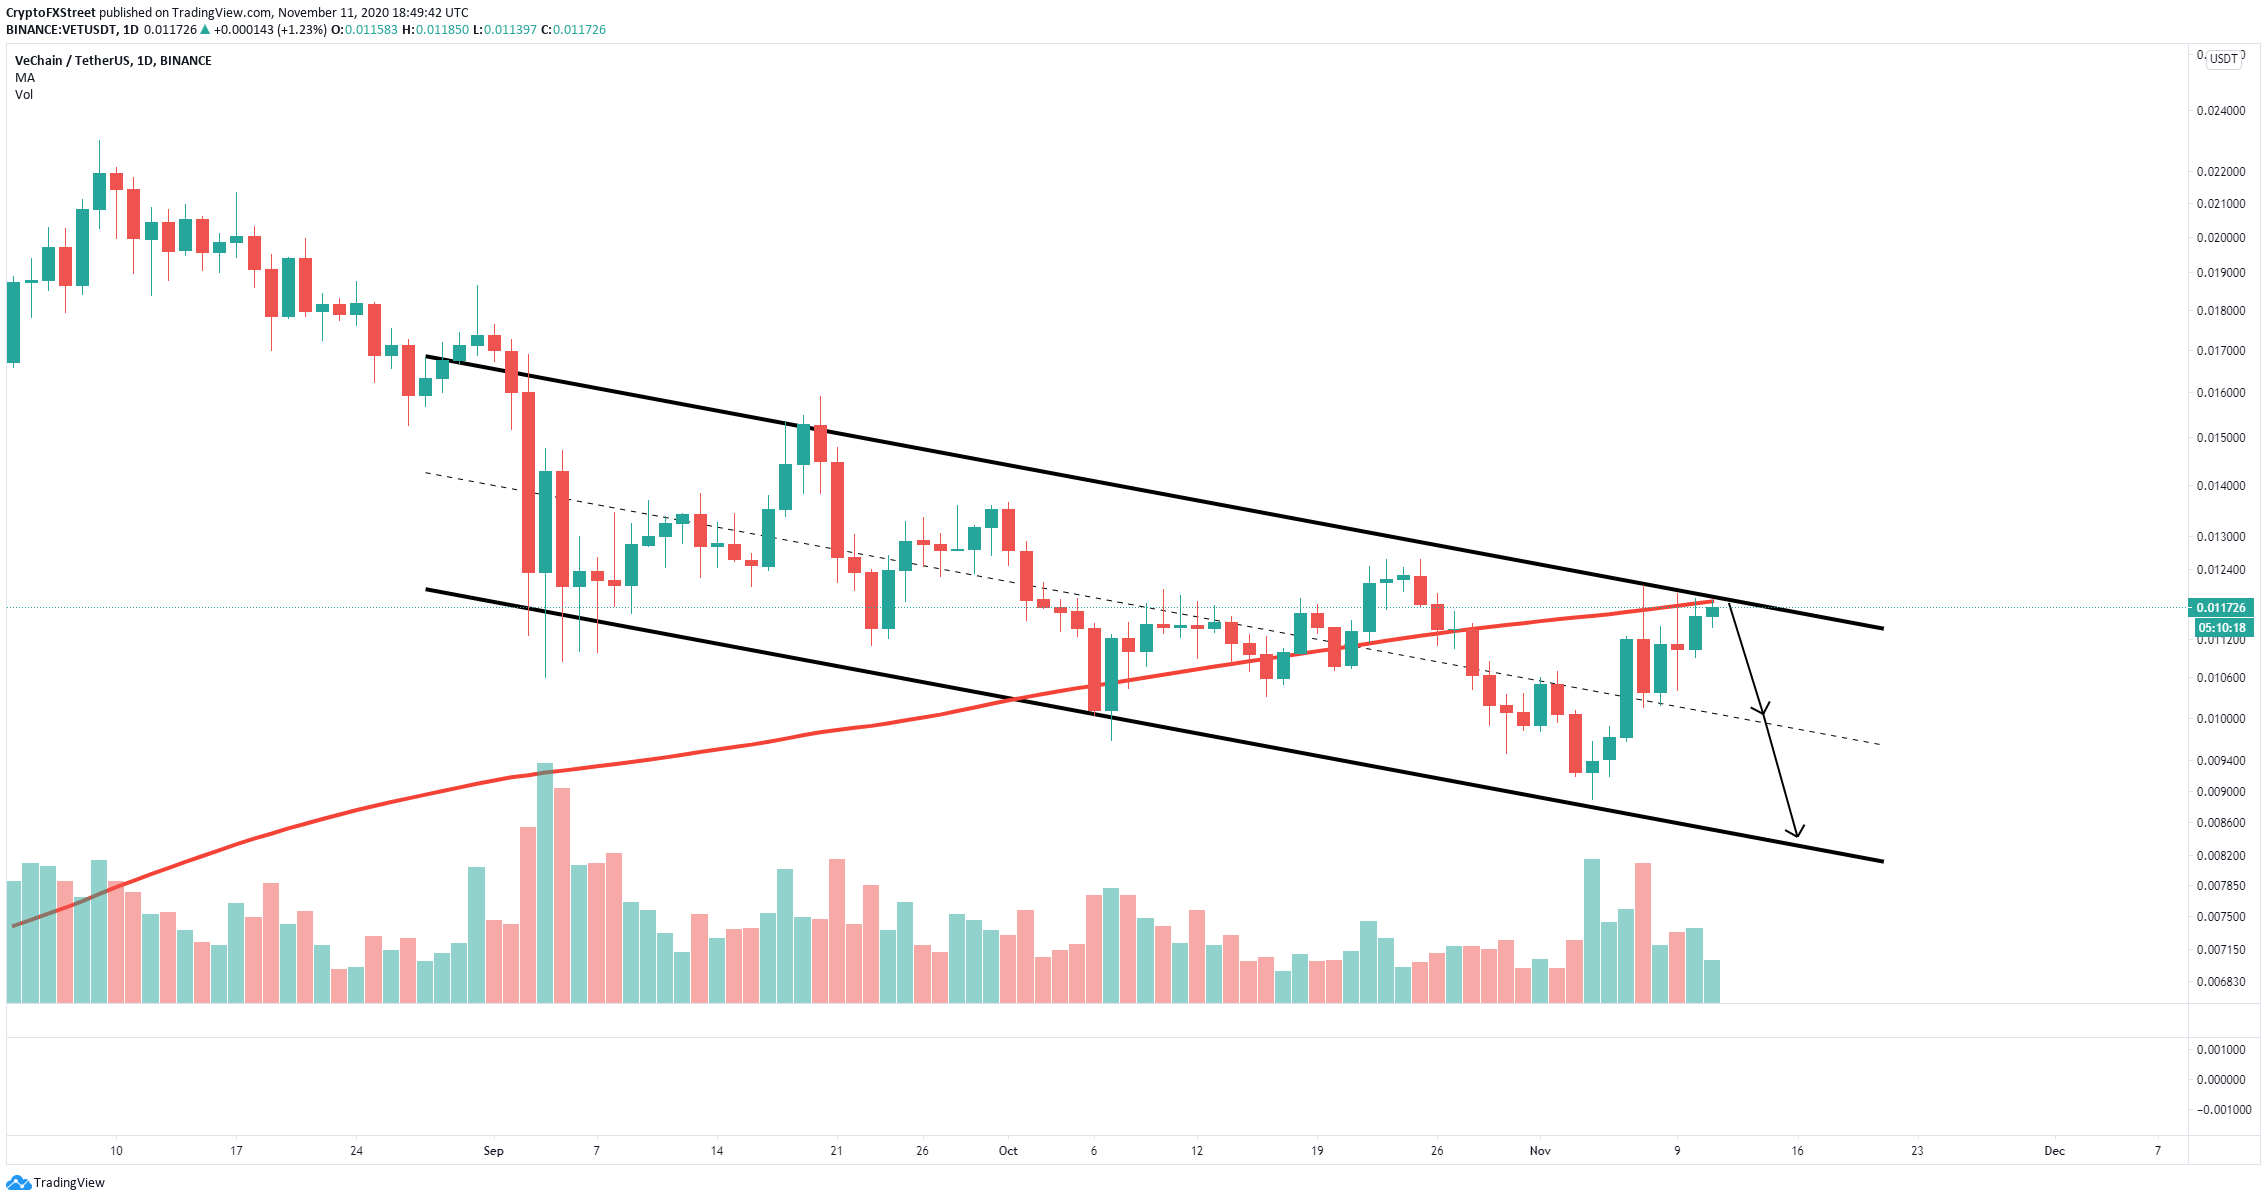
VET/USD daily chart
The 200-SMA coincides with the upper boundary, adding more strength to this resistance level. Rejection from that point can quickly push Vechain price towards the middle of the pattern at $0.01 and as low as $0.008.
Author

Lorenzo Stroe
Independent Analyst
Lorenzo is an experienced Technical Analyst and Content Writer who has been working in the cryptocurrency industry since 2012. He also has a passion for trading.


