VeChain Price Analysis: VET breakout encounters massive resistance at this crucial level
- Multiple technical indicators highlight a potential correction to the recent VET/USD uptrend.
- VeChain's high network growth could invalidate the expected downtrend and refocus the price on an upward trajectory.

VeChain has plunged by more than 60% from the peak traded in August at $0.023 before embracing support at $0.009. A recovery ensued, lifting the token above $0.01, but immense seller congestion appears to have capped the bullish price action.
VeChain uptrend stalls under a massive barrier
VET/USD is doddering at $0.0118 after suffering a rejection marginally below the 100-day Simple Moving Average. The bearish price action has already extended beneath the 200-day SMA. Meanwhile, the token’s downside is holding slightly above the 50-day SMA.
Before hitting a wall against the resistance, VeChain made a remarkable breakout above a descending wedge pattern. The pattern is created by connecting higher highs and lower lows using trendlines. Usually, descending wedges signal that an extended downtrend is approaching an elastic limit, and a reversal is around the corner. Besides, a breakout above the wedge tends to occur before the trendlines converge, as observed on the chart.
 (4)-637412852948871281.png)
VET/USD daily chart
The prevailing bearish outlook has been reinforced by the Relative Strength Index stalling slightly above the midline. If the index dives below the average line, more sell orders might be triggered, creating enough volume to force break down towards $0.01.
The RSI on the 12-hour chart seems to validate the bearish outlook after printing a bearish divergence. This divergence is created when the RSI prints a higher low pattern; simultaneously, the price makes a higher low pattern. In other words, the index highlights decreasing buying volume, hence the possibility for correction.
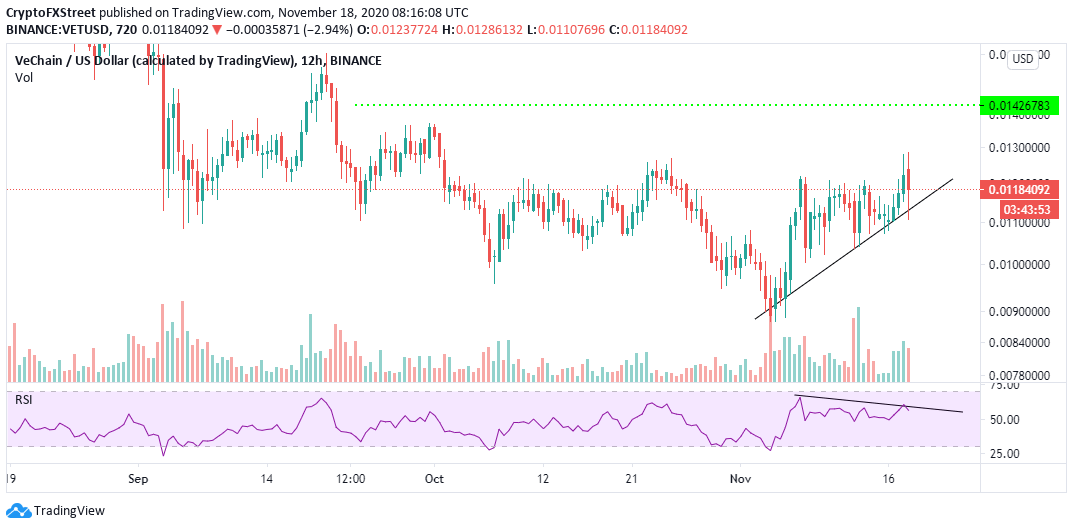
VET/USD 12-hour chart
According to the “Daily New Addresses” metric by IntoTheBlock, VeChain’s network has been receiving immense attention owing to a higher pattern created by the number of new addresses joining the network.
-637412853755616238.png)
VeChain new addresses chart
The metric shines a light on the increase in adoption as new investors stream into the project. In other words, high network growth is a bullish indicator for the project and the future value of the digital asset, thus it might help VET/USD to stay above the crucial $0.01 mark.
Author

John Isige
FXStreet
John Isige is a seasoned cryptocurrency journalist and markets analyst committed to delivering high-quality, actionable insights tailored to traders, investors, and crypto enthusiasts. He enjoys deep dives into emerging Web3 tren


