Uniswap Price Prediction: UNI could be on the verge of a massive bounce
- UNI is currently trading at $3.24, showing significant bullish strength.
- The digital asset is still trying to establish a clear bottom.

After its release, UNI had a massive bull rally towards $8.6, which only lasted a few days. The digital asset is down 62% since its peak and struggling to find the bottom.
UNI showing signs of a recovery
On the 12-hour chart, the bulls are already showing some strength after setting a low at $2.47 and bouncing towards $3.36. The MACD is slowly turning bullish, which has never happened before.
UNI/USDT 12-hour chart
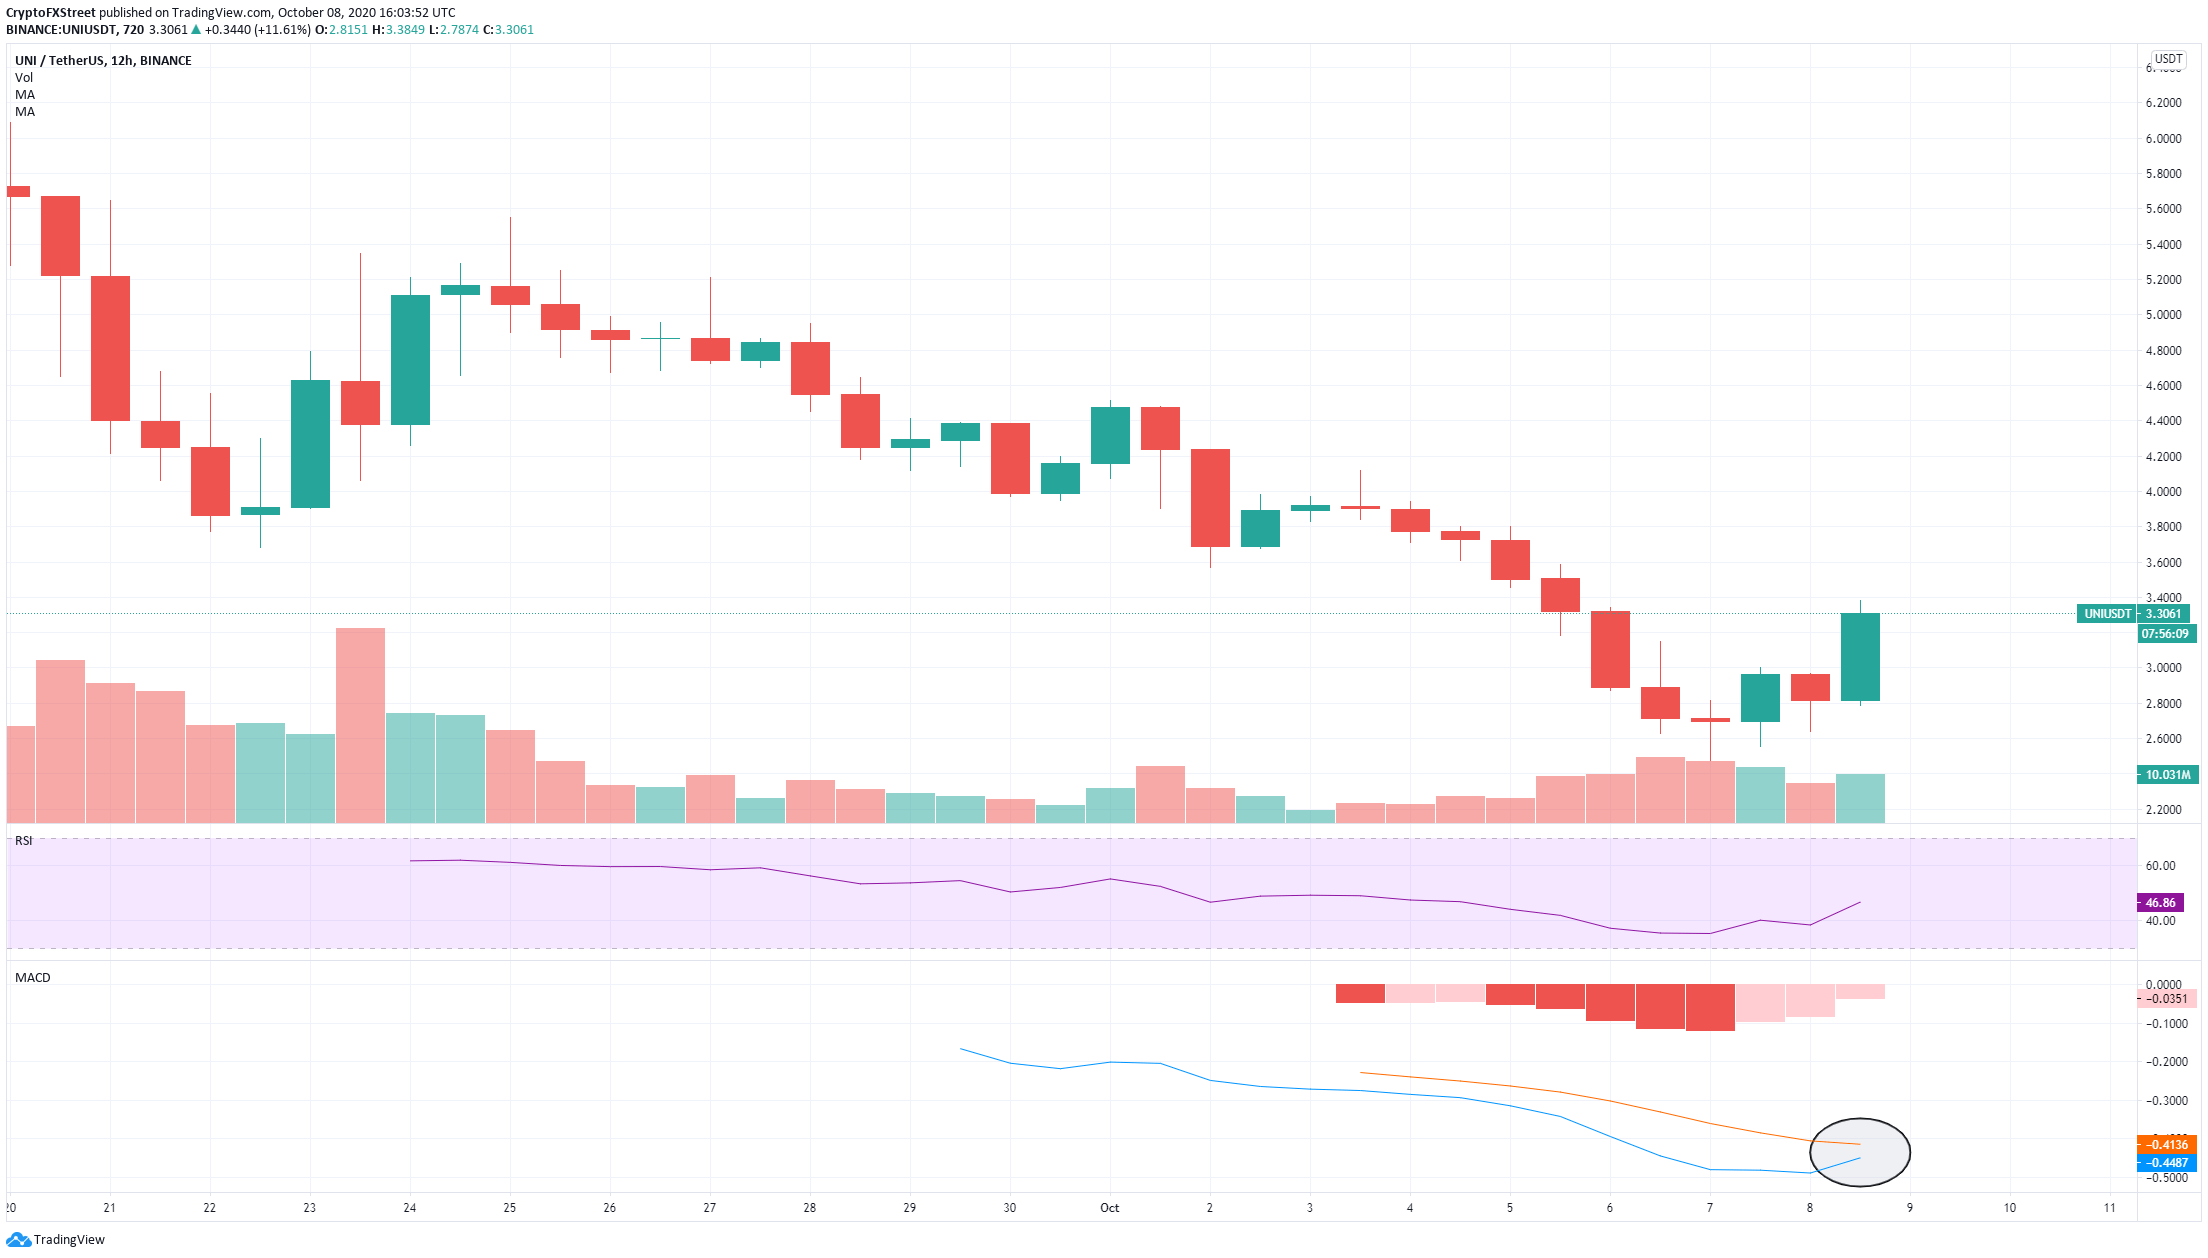
On Binance, UNI sees a slight increase in trading volume over the past few days compared to October 1-5. This would indicate that the bullish momentum is starting to pick up.
UNI New Addresses
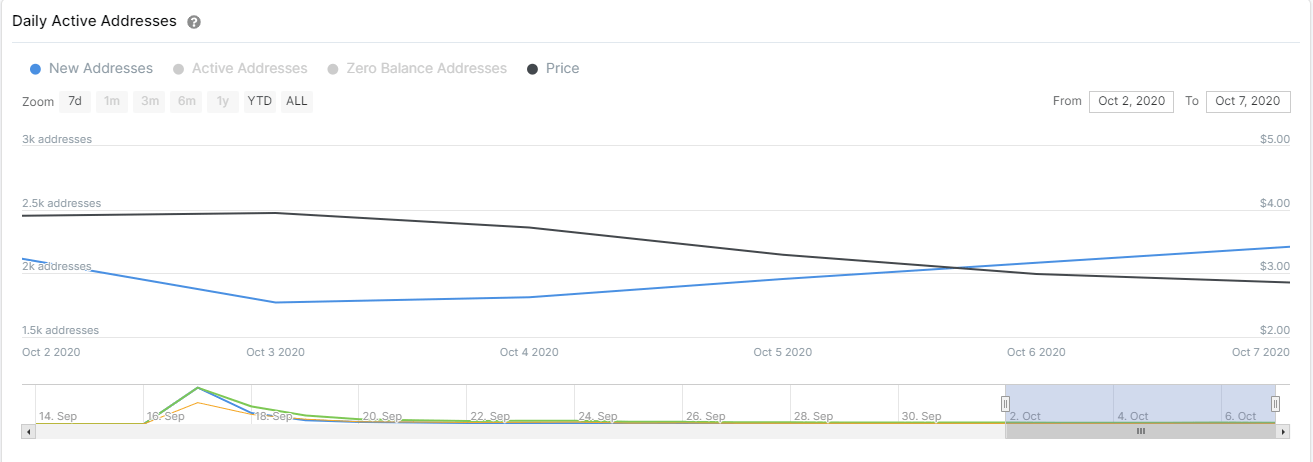
Another metric in favor of the bulls is the increase in new addresses joining the network. Using the chart provided by IntoTheBlock, we can observe a continuous increase in this number since October 3 from 1,770 addresses to 2,210.
UNI/USD 1-hour chart

The recent bullish momentum has taken UNI price above the 50-SMA and the 100-SMA on the 1-hour chart, turning both into support levels. The rise in trading volume is far more apparent here. The MACD also turned bullish again. The next potential price target for UNI would be $3.5, where the 4-hour 50-SMA is established.
UNI IOMAP Chart

On the other hand, the In/Out of the Money Around Price chart shows strong resistance ahead. The range between $3.37 and $3.47 has a volume of 12 million UNI, representing a crucial resistance area.
A rejection from this point will drop UNI towards $2.94. The IOMAP chart indicates that the $2.86-2.94 range is the healthiest support area.
Author

Lorenzo Stroe
Independent Analyst
Lorenzo is an experienced Technical Analyst and Content Writer who has been working in the cryptocurrency industry since 2012. He also has a passion for trading.



