UniSwap Price Analysis: UNI rebounds from the dip, bulls aim higher
- UniSwap breaks above a key descending trendline, opening the door for gains towards $5.5.
- On-chain analysis reveals that whales are still stocking up on the crypto, hence the bullish momentum.

The decentralized finance (DeFi) tokens have retreated extensively in the past few weeks. However, the story is a bit different when it comes to the newly-launched UNI token, and perhaps it’s because it has only been in the market for a few days. UNI commenced trading on Binance around $0.25 on September 17. Later the price rallied to highs of $8.64. However, selling pressure gripped the token, resulting in losses that embraced support at $3.65.
UNI is a token launched by UniSwap, a fully decentralized blockchain platform, providing automated liquidity on top of Ethereum. According to a statement released by UniSwap, UNI was released for “enabling shared community ownership and a vibrant, diverse, and dedicated governance system, which will actively guide the protocol towards the future.”
UNI bounces off support to resume the uptrend
UNI is up over 20% in the last 24 hours, according to the data by CoinMarketCap. Following the support established at $3.65, the crypto bounced back, stepping above the 50 Moving Average (MA) at $4.2. An increase in buy orders pulled the price further up, but high congestion of sellers formed a barrier at $5.5. A retreat from this level held above the 50 MA, giving bulls a chance to regain control.
UNI/USD hourly chart
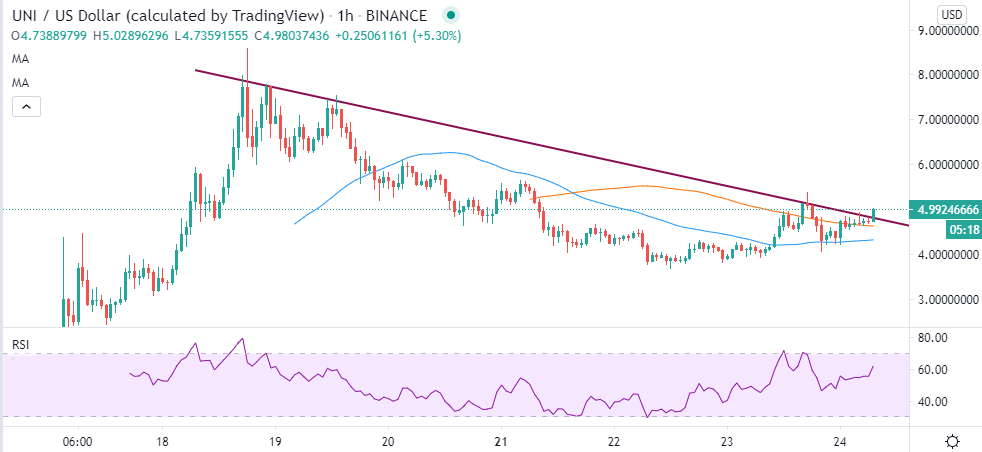
At the time of writing, UNI/USD is doddering at $4.95 after overcoming the tentative resistance at the 100 SMA in the hourly range. Moreover, UNI is trading above a critical descending trendline. The Relative Strength Index in the same hourly range is almost crossing into the overbought region. A move of such magnitude by the RSI would signal more buying orders as investors rush to capitalize on the expected gains.
IntoTheBlock’s IOMAP model reveals the presence of substantial resistance between $5.02 and $5.17. Based on this metric, 277 addresses previously purchased 10.68 million UNI. Bulls are likely to work hard and hopefully flip this zone into support. If that happens, UNI could extend the bullish leg beyond $5.5.
UNI IOMAP chart
-637365345631576046.png)
On the downside, UNI is sitting on robust support, presented by the 5,110 addresses that bought 37.4 million UNI in the range, $4.86-$4.99. It is doubtful that declines will break below this zone. However, if they do, the losses could stretch to the region between $4.56 and $4.64, where 354 addresses previously purchased 2.87 million UNI.
Consequently, Santiment’s holder distribution metric highlights that whales have not slowed down on increasing their UNI holdings. For instance, wallets holding between 100,000 and one million UNI have surged from 80 on September 17 to 123 on September 24.
A similar trend has also been recorded for whales holding one million - 10 million UNI, with thier number increasing from 25 to 34 in the same period. Intense buying pressure is behind UNI’s upswing and the whales' uptake of the token continues, we are likely to witness a surge in the value of UNI.
UNI holder distribution chart
 [11.25.02, 24 Sep, 2020]-637365346073150577.png)
Looking at the other side of the fence
It is worth mentioning that resistance at $5.02 - $5.17, as highlighted by the IOMAP model, may prevent UNI from extending the upward leg to $5.5. On the other hand, retreat from the prevailing price level must hold above the 100 MA to avert losses that could retest the 50 MA support.
Author

John Isige
FXStreet
John Isige is a seasoned cryptocurrency journalist and markets analyst committed to delivering high-quality, actionable insights tailored to traders, investors, and crypto enthusiasts. He enjoys deep dives into emerging Web3 tren


