Uniswap Price Prediction: UNI drops 15% and it’s at risk of falling further
- UNI is currently trading at $3.04 after a significant 15% pullback.
- The digital asset had a strong rebound from a low of $2.47.

UNI is one of the most successful cryptocurrencies reaching a market capitalization of $630 million on the first day of trading. Unfortunately, the initial rally didn’t last long and UNI lost a lot of value, currently only at $300 million in market cap with $500 million in trading volume.
Uniswap bearish momentum continues strengthening
On the 12-hour chart, the digital asset was in free-fall mode until it hit $2.47, a temporary bottom. The rebound was strong and UNI exploded 46% to the upside hitting a high of $3.65 on October 10 and turning the MACD bullish for the first time ever.
UNI/USDT 12-hour chart
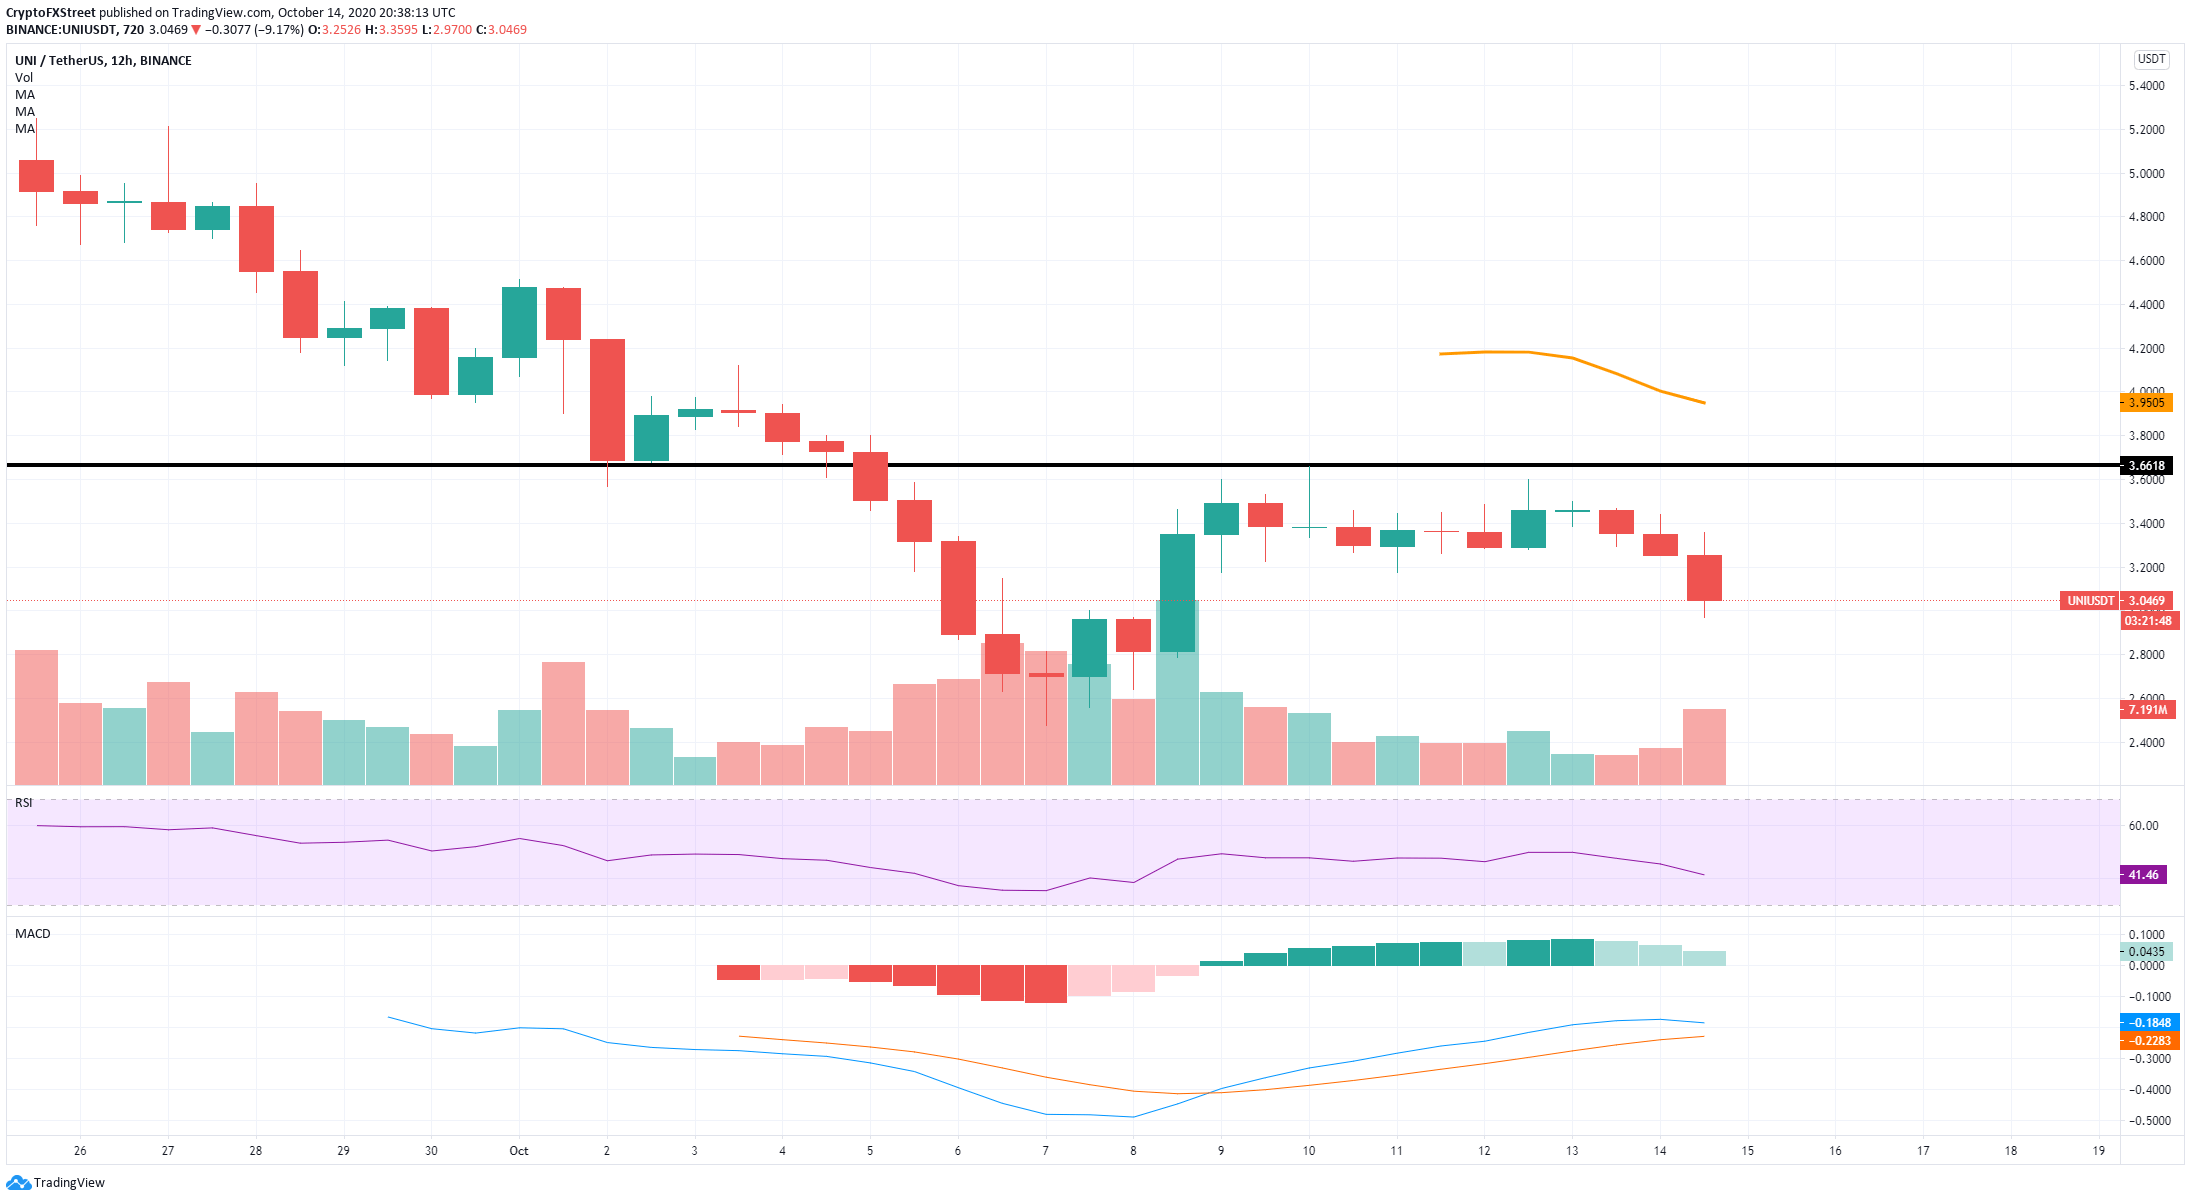
After trying to re-test the high at $3.65 on October 12, the price got rejected heavily and dropped 15% within the next two days. The MACD is on its way to cross bearishly again and trading volume is increasing while the price is dropping, another bearish sign.
UNI New Addresses Chart
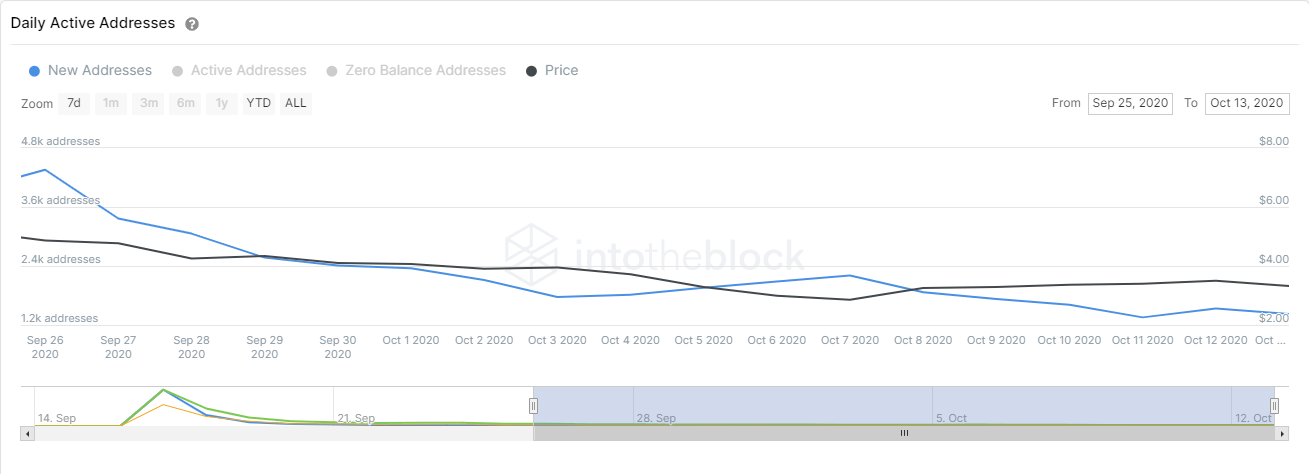
Furthermore, the downtrend in the number of new addresses joining the network continues. On September 26, this number was 4,360 addresses per day. It has dropped to a low of 1,420 and continues declining, noting a lack of interest in the digital asset despite the recent rebound. If the bearish trend continues advances, UNI could drop towards the low at $2.47.
UNI/USDT 15-minutes chart
-637383052027968495.png)
The bulls are currently trying to push UNI above $3.08 on the 15-minutes chart to confirm an uptrend. UNI managed to establish a higher low at $3.01 compared to $2.97 and only needs to set a higher high now. The MACD has turned bullish and continues strengthening.
UNI IOMAP Chart
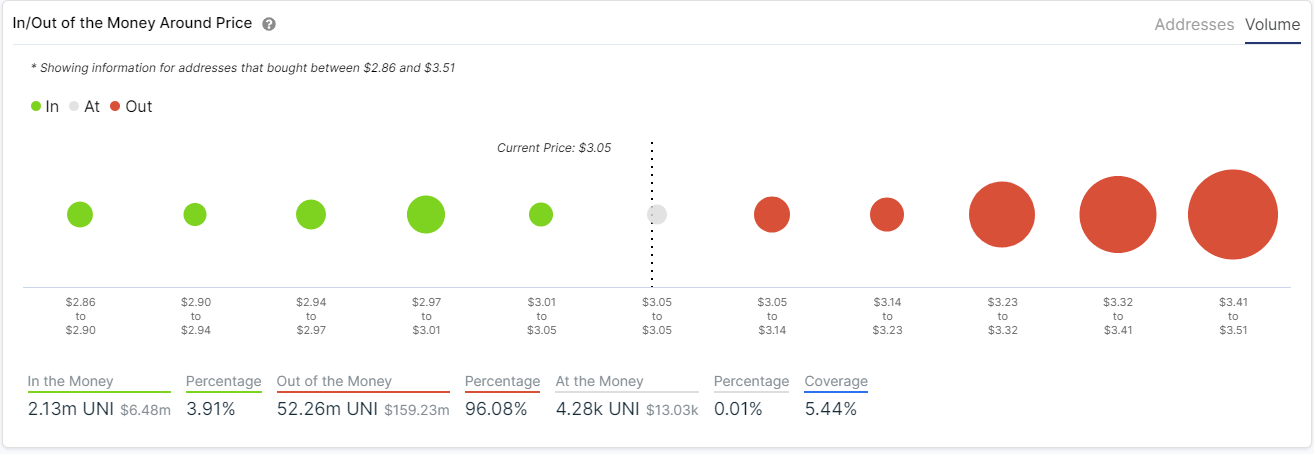
The In/Out of the Money Around Price chart shows a lot of resistance above $3.23, however, very little opposition from $3.05 until $3.23. A breakout above $3.08 can easily push UNI to $3.23 in the short-term and as high as $3.32.
Key price points for UNI
The recent rebound of UNI was a relief for the bulls after an extended downtrend. Buyers need to pay close attention to the resistance level at $3.08 established on the 15-minute chart. A breakout above this point can push UNI towards $3.23 and up to $3.32 in the short-term.
On the other hand, if the downtrend continues, we could see UNI slipping further. There is a concerning downtrend in the number of new addresses joining the network. The next bearish target price would be around $2.47, the low of the last downtrend.
Author

Lorenzo Stroe
Independent Analyst
Lorenzo is an experienced Technical Analyst and Content Writer who has been working in the cryptocurrency industry since 2012. He also has a passion for trading.



