Uniswap Price Prediction: UNI consolidates before pump to $21
- Uniswap price has entered a minor correction toward $18 after hitting resistance at $19.30.
- The technical setup is still very much in favor of Uniswap going higher.
- UNI enjoys the current risk-on environment, and fundamentals are still in benefit of it going higher.

Uniswap price hit $21 last night before dipping lower toward $18. All the technical elements and fundamental indicators are still in favor of UNI going upwards.
UNI ready for the pop higher toward $21
Uniswap price hit an essential barrier at $19.30 last night. UNI had last seen this level on June 21 and has not been tested since. The rejection at $19.30 and the downturn looks standard, with short-term profit-taking and Uniswap price now looking for support where buyers will come in again.
From a technical point of view, UNI has respected the blue upward trend line three times. A bounce off that trend line would make sense for buyers to come in, and Uniswap price would head higher toward $19.30 again. The level UNI is looking for is around $18, which will act as a psychological level and at the 23.6% Fibonacci level. So there are three technical reasons to go long UNI.
Once the bounce off that blue trend line happens, UNI can go to $19.30 again for the retest. That would be the third test and is highly likely to break to the upside. Even if it does not break to the upside, we would then fall into a triangle technical setup, which would squeeze UNI higher. It is only a matter of time before UNI will reclaim $19.30.
The RSI favors the long UNI as well, with the RSI around 55, so nowhere near overbought or oversold. With the general risk-on sentiment from the past few days, momentum is certainly in favor of Uniswap price trending higher.
The profit target is $21.05, which has proven its importance on June 13 with a triple bottom and June 21 with support on an initial test to the downside by Uniswap price. Only after the clear break lower did $21.05 become resistance with two rejections to the downside, and UNI has not made it back since.
The level looks more than ready for a retest.
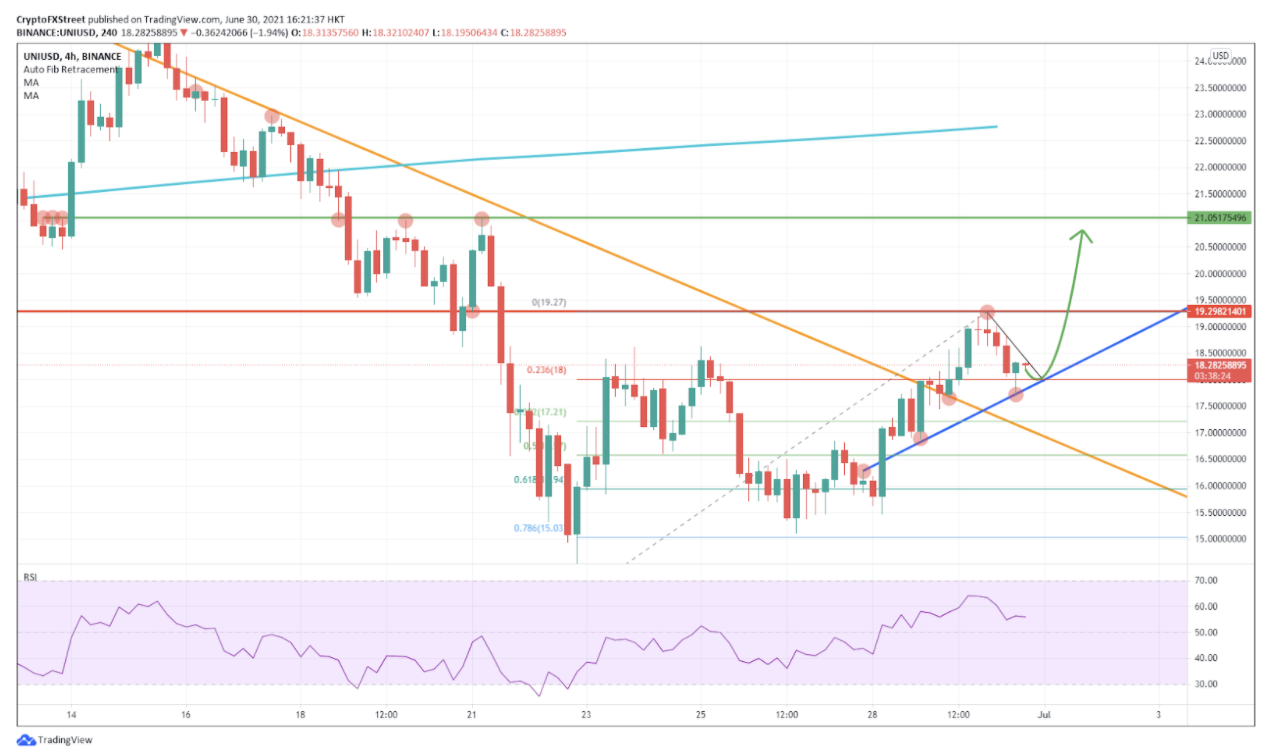
UNI/USD 4 hour chart
However, sentiment this morning in the markets is lackluster. Markets are not sure which way to look for direction, and the risk-on tone might not be there today to support Uniswap price. So once the blue trend line and the level at $18 would break to the downside, UNI will dip lower toward $17 and look for a bounce off the orange descending trend line. Should even the orange trend line and $17 not hold, then be ready for a retest of $15.
Author

Filip Lagaart
FXStreet
Filip Lagaart is a former sales/trader with over 15 years of financial markets expertise under its belt.




