Uniswap Price Analysis: UNI strengthens, but still not time to fasten the seatbelts
- Uniswap price is releasing above a declining trend line originating in mid-May.
- UNI 50 twelve-hour simple moving average (SMA) hovers just 10% above current prices, maybe containing a sustainable rally.
- Based on In/Out of the Money Around Price (IOMAP), the defi token is confronted by significant resistance at current prices.

Uniswap price has climbed almost 40% from the June 22 low and seized the opportunity of an oversold reading on the twelve-hour Relative Strength Index (RSI) to slingshot above a longstanding trend line beginning on May 14. If UNI can close above the trend line on a daily basis, there is a potential for the altcoin to charge higher, but there is still more to prove.
Uniswap price dictates patience and flexibility
Uniswap price dived 70% from the May 2 high of $45.02 to the May 23 low of $13.01, logging one of the smaller corrections in the cryptocurrency complex. The May 23 low, which was not tagged during the weakness in June, was defined by a bullish hammer candlestick pattern. The pattern unleashed an impulsive wave that stalled at the 50% retracement of the May correction, where UNI transacted until collapsing 50% into the June 22 low.
Today, Uniswap price is generating interest above the instructive May declining trend line, a resistance level that suffocated several rally attempts in the first half of June. The developing rally from the June 22 low of $13.90 has looks corrective and is nearing resistance constructed by a price range around the June 12 low of $20.25 and the 50 twelve-hour SMA at $20.82.
Due to the lack of impulsiveness of the rebound, Uniswap price needs to prove itself with a daily close above the June 12 low of $20.25. If UNI accomplishes the requirement, it should find little difficulty overcoming the 50 twelve-hour SMA at $20.82, thereby freeing the digital asset to test the 200-day SMA at $22.76.
A continuation of the rally beyond the 200-day will be a challenge due to the declining 50-day SMA and the nearing bearish Death Cross pattern. The combination will weigh on price, at least in the short term.

UNI/USD 12-hour chart
The cryptocurrency market is having one of the better days in the last month, but the magnitude of resistance stacked in front of the cryptocurrencies recommends evaluating the downside possibilities.
A failure of Uniswap price to hold the May declining trend line at $17.84 will lead to a swift test of the minor trend line beginning June 22. UNI investors can anticipate some support, but the higher probability outcome is at least a test of the June 22 low and potentially a drop to the May 23 low of $13.01.
One metric arguing against continuing the emerging rally is the IntoTheBlock In/Out of the Money Around Price (IOMAP). The metric shows a substantial cluster of resistance (out of the money addresses) from $19.05 to $19.59, where 3.79k addresses hold 124.14m UNI at an average cost of $19.45.
The resistance range indicates that Uniswap price will be unsuccessful in reaching the June 12 low of $20.25.
Compounding the bearish tilt of the metric is that there is virtually no support (in the money addresses) from $19.05 to $16.15, proposing that renewed selling pressure will not face push back until at least the June 22 minor trend line now at $16.33.
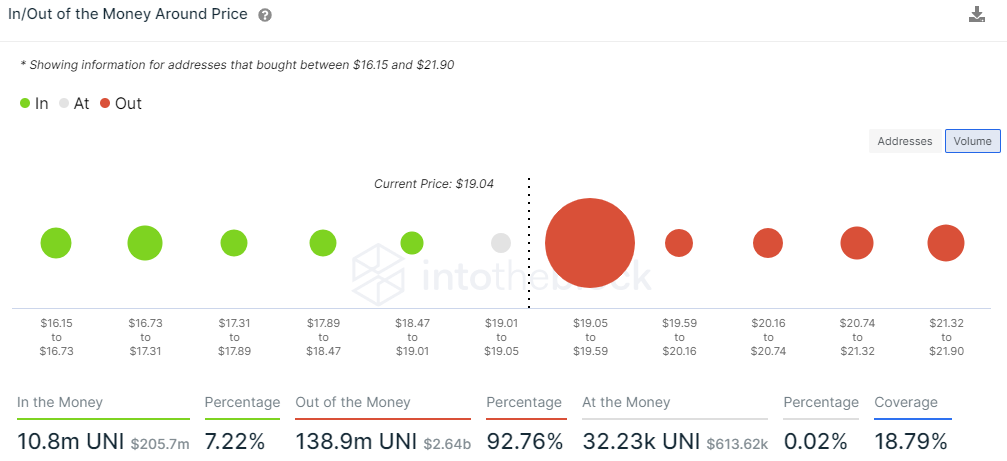
UNI IOMAP - IntoTheBlock
With that said, if Uniswap price breaks through $19.59, there is no identifiable resistance to at least $21.90.
The below chart also highlights a headwind for UNI investors. The decentralized trading protocol's Total Value Locked (TVL) assets have dropped from May 14 high of $8.0b to $4.9b at the June 26 low, representing a 38% decline.
Clearly, the significant momentum in DeFi projects that headlined earlier this year has slowed substantially. However, there may be a green shoot as the Uniswap TVL breaks out above the declining trend line in May.
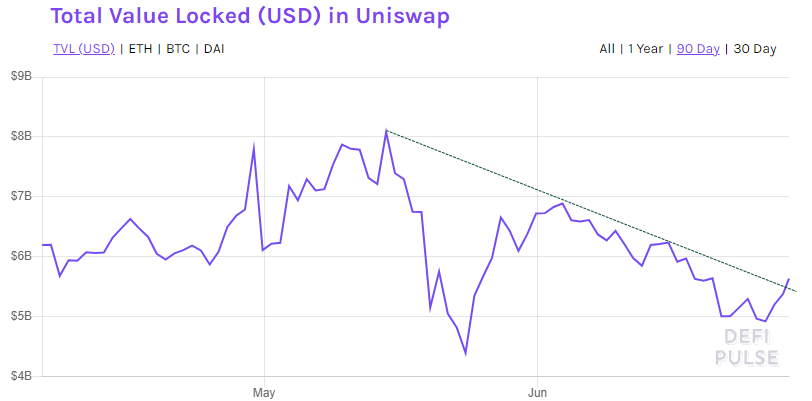
UNI TVL - DEFI PULSE
Challenges remain for Uniswap price, and it is too early to fasten the seatbelts for an impulsive dash higher. The preference should be for flexibility to let UNI prove itself in the days ahead.
Author

Sheldon McIntyre, CMT
Independent Analyst
Sheldon has 24 years of investment experience holding various positions in companies based in the United States and Chile. His core competencies include BRIC and G-10 equity markets, swing and position trading and technical analysis.


