Solana Price Forecast: SOL holds above $126 as Real-World Asset growth and ETF inflows boost sentiment
- Solana price steadies above $126 on Friday after closing above a key resistance level the previous day.
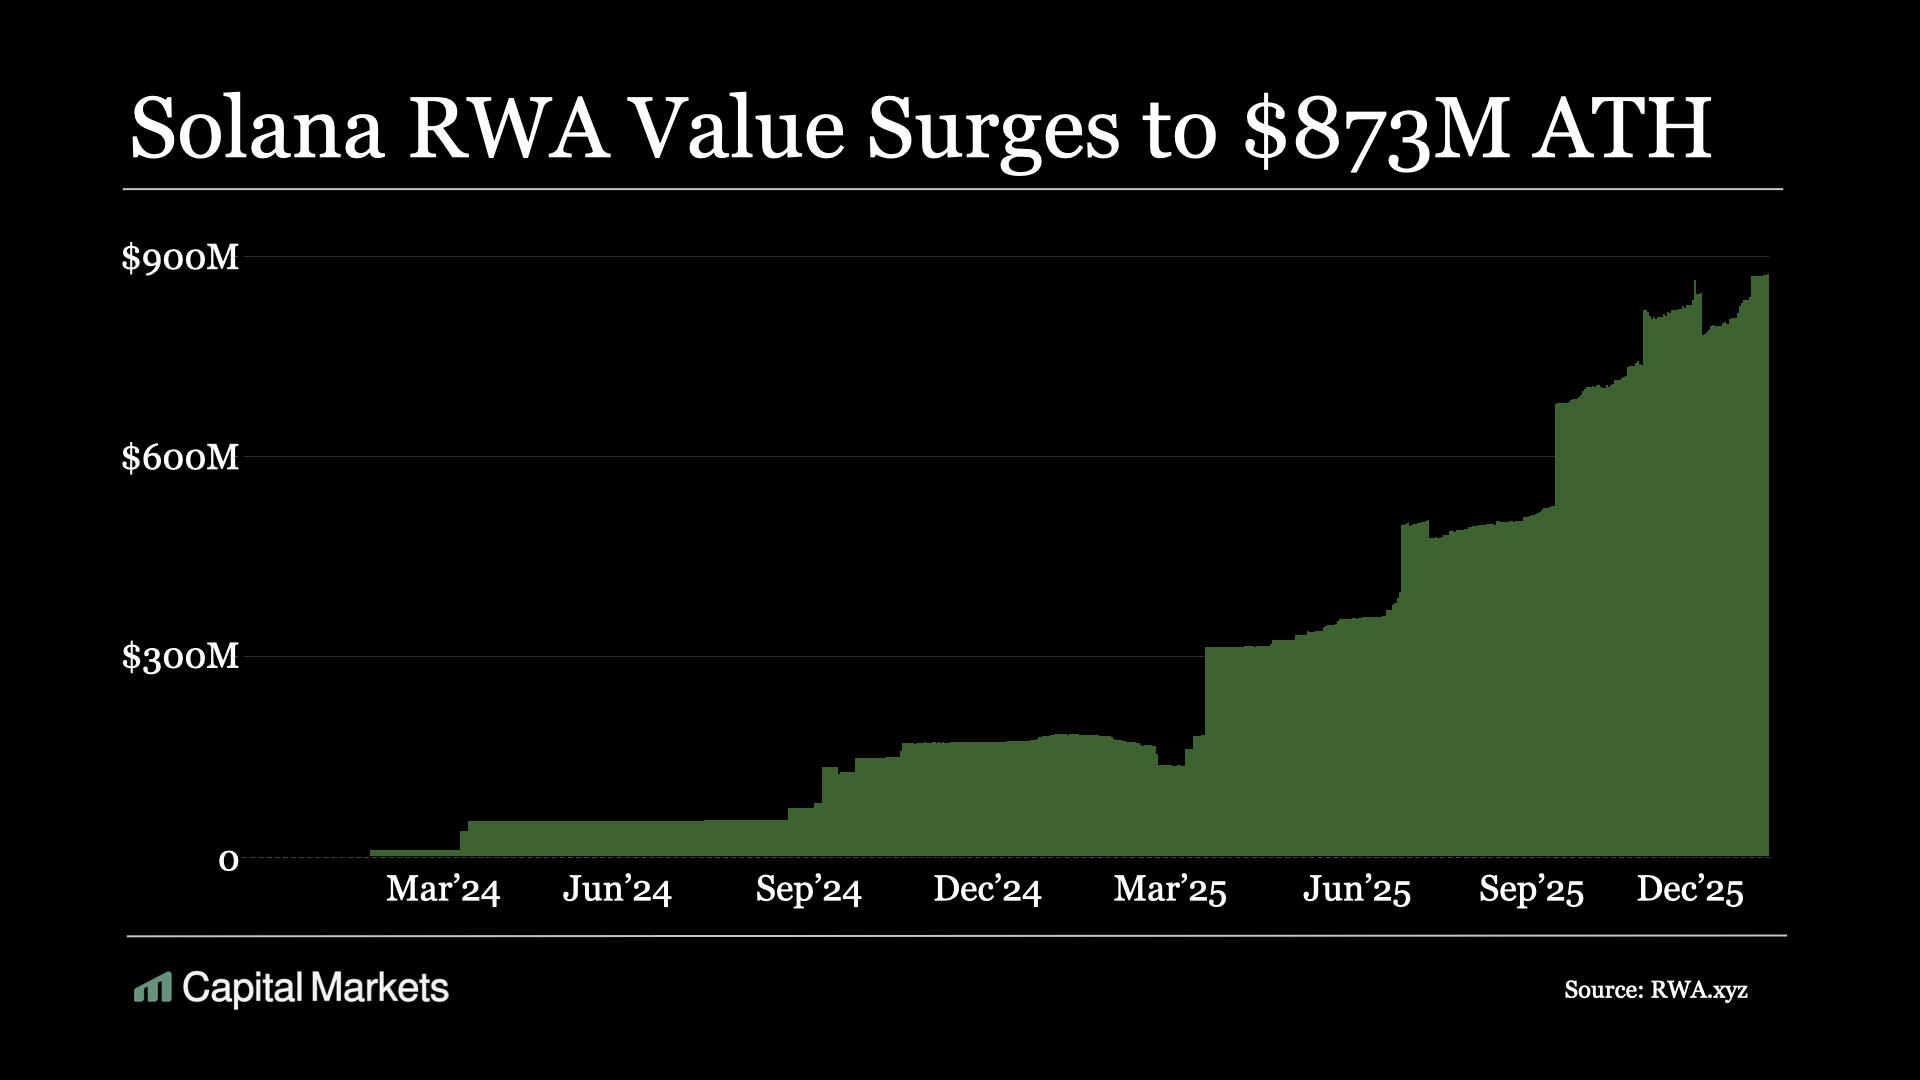
- On-chain data show that Solana’s RWA ecosystem is at an all-time high of $873 million, highlighting growing network adoption.
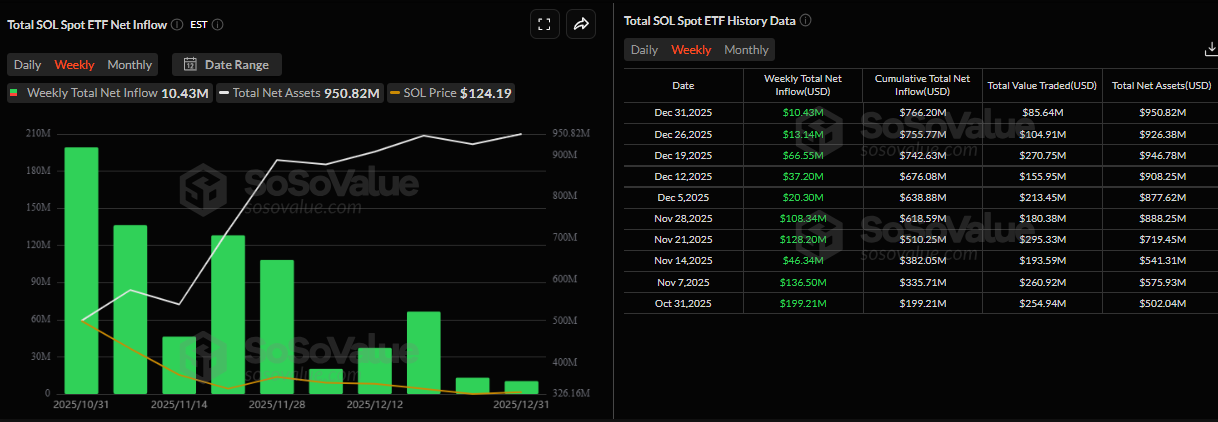
- Solana spot ETFs record a $10.43 million weekly inflow, extending a streak of consistent inflows since their launch in October.

Solana (SOL) trades above $126 on Friday, following a decisive daily close above the key resistance zone the previous day. On-chain data indicate strengthening fundamentals, as Solana’s real-world asset (RWA) ecosystem reaches a new all-time high of $873 million. At the same time, demand for spot Solana Exchange-Traded Funds (ETFs) remained firm, with consistent inflows since their launch. All these factors suggest upside for SOL in the near term.
Solana RWA hits new all-time highs, spot ETFs inflows persist
According to Capital Markets data, Solana’s RWA ecosystem reached a new all-time high of $873 million in value on Thursday. This rise indicates growing institutional adoption and strengthening confidence in SOL’s real-world asset infrastructure.
In addition, institutional demand for SOL has continued to grow since its launch on October 28. SoSoValue data shows that spot Solana ETFs have recorded $10.43 million in net inflows this week, extending a streak of consistent weekly inflows since their October launch. Moreover, the total net assets reached $950.82 million as of Thursday, suggesting institutions are accumulating SOL during consolidation rather than reducing exposure.
Solana Price Forecast: SOL closes above key resistance level
Solana price broke above the upper trendline of a falling wedge pattern (drawn by joining multiple highs and lows since early October) on December 26, rose slightly, but failed to close above the weekly resistance at $126.65 toward the end of December. On Thursday, SOL rose 2% and closed above this resistance level; as of Friday, it remains above $126.86.
If the $126.65 weekly level holds as support, SOL could extend the rally toward the next daily resistance at $160.
The Relative Strength Index (RSI) on the daily chart reads 47, pointing upward toward the neutral level of 50, indicating fading bearish momentum. For the bullish momentum to be sustained, the RSI must move above the neutral level. Meanwhile, the Moving Average Convergence Divergence (MACD) indicator showed a bullish crossover, which remains intact, supporting a positive outlook.
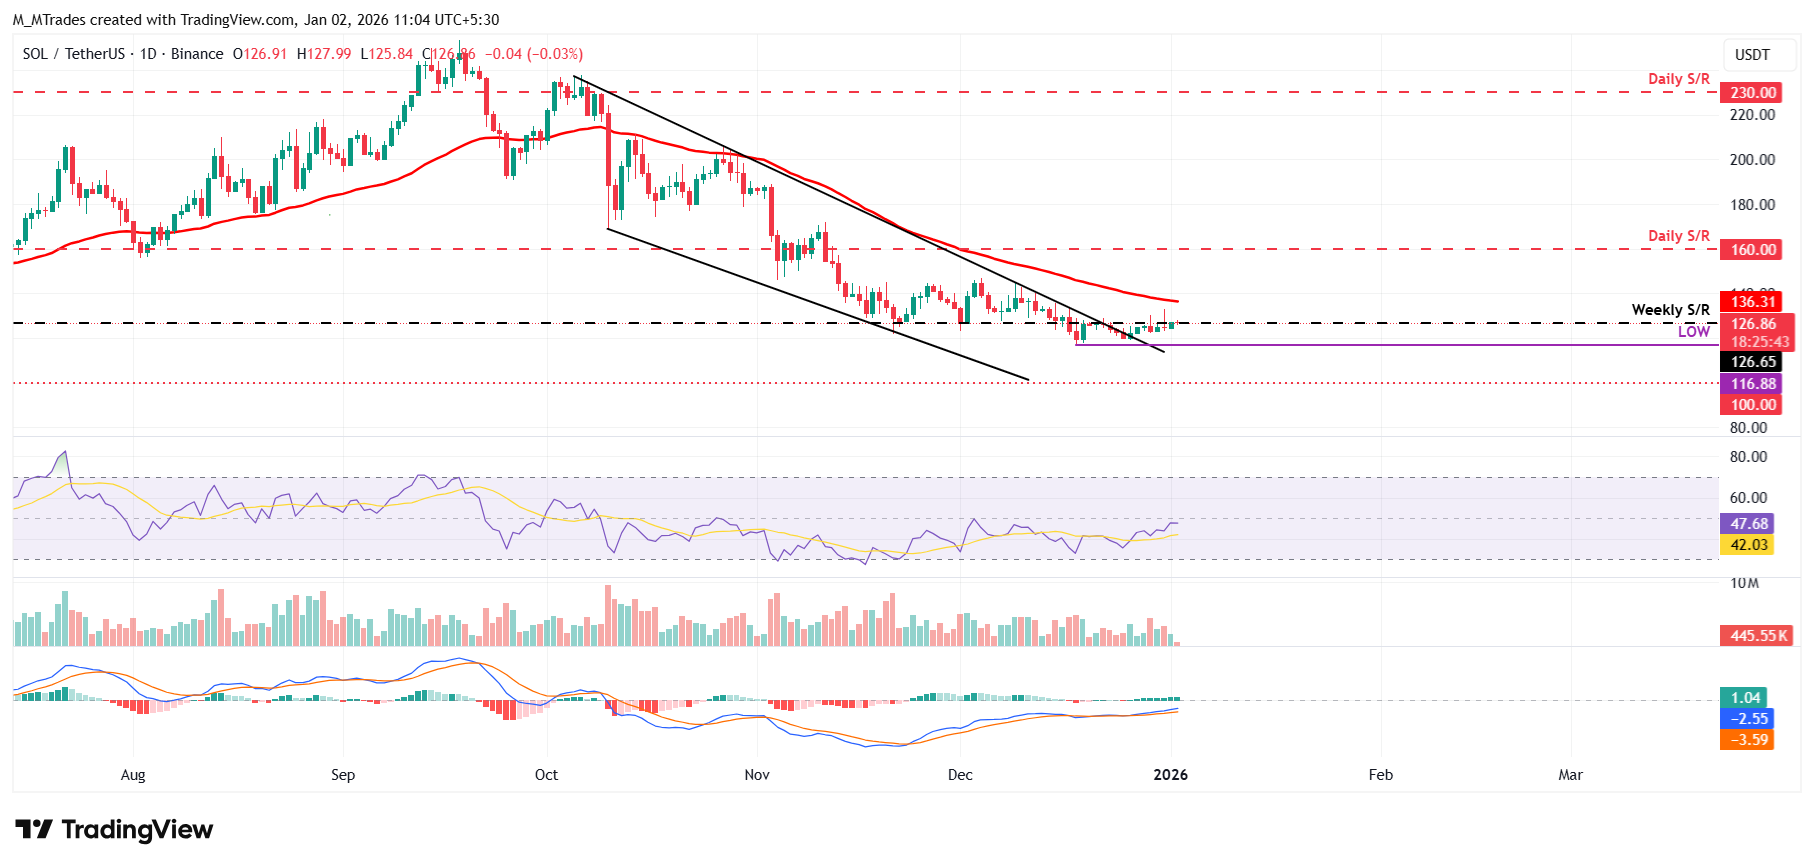
On the other hand, if SOL fails to find support at $126.65, it could extend the decline toward the December 18 low of $116.88.
Author

Manish Chhetri
FXStreet
Manish Chhetri is a crypto specialist with over four years of experience in the cryptocurrency industry.



