UMA Price Prediction: UMA ready for a run to $8
- UMA eyes rebound to the 50 SMA after bouncing off descending triangle support.
- Bulls are relative in control, as observed by the RSI changing direction to the north.

UMA established support at $5.8 at the beginning of October and commenced an upswing that hit highs above $12. Unfortunately, the impressive rally was unsustainable. Bears took control, forcing UMA on a downward spiral.
High support resting on the $7 level saw bulls regain balance. However, the price action was constrained in a descending triangle pattern. At the time of writing, UMA/USD is trading at $7.3 after a rebound from the triangle's x-axis. If gains continue and the crypto steps above the triangle's hypotenuse, we can expect UMA to begin the rally to $8.
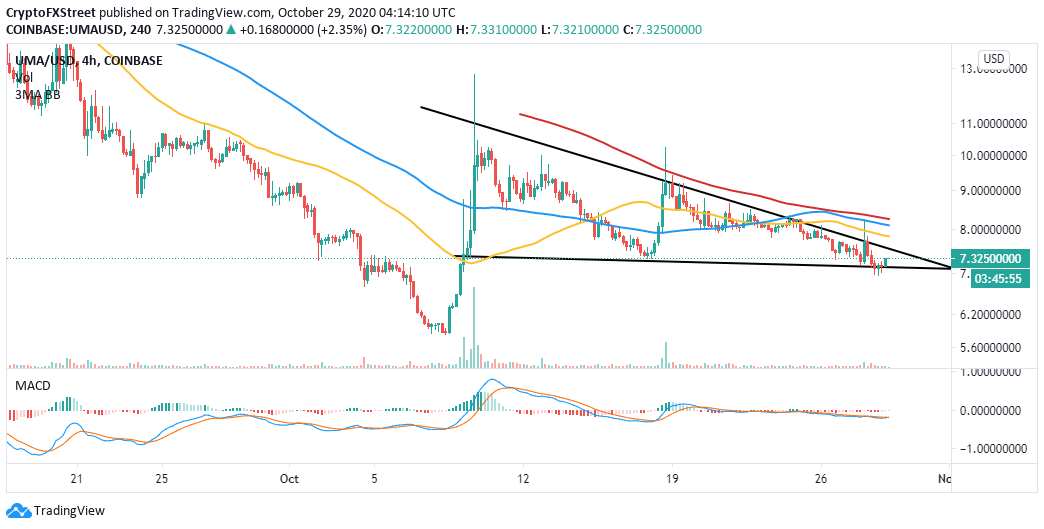
UMA/USD 4-hour chart
The Relative Strength Index (RSI) also doubles down on the increasing bullish grip. The uptrend seems sustainable, especially if the RSI breaks above the descending trendline. Above the triangle, the 50 Simple Moving Average (SMA) and the 100 SMA in the 4-hour timeframe might delay recovery.
The TD Sequential indicator has flashed a buy signal on the 12-hour chart, giving credence to the uptrend. An increase in buy orders could potentially result in a rally to the crucial resistance at $10. However, it is essential to note that the 50 SMA may delay the price action around $8.
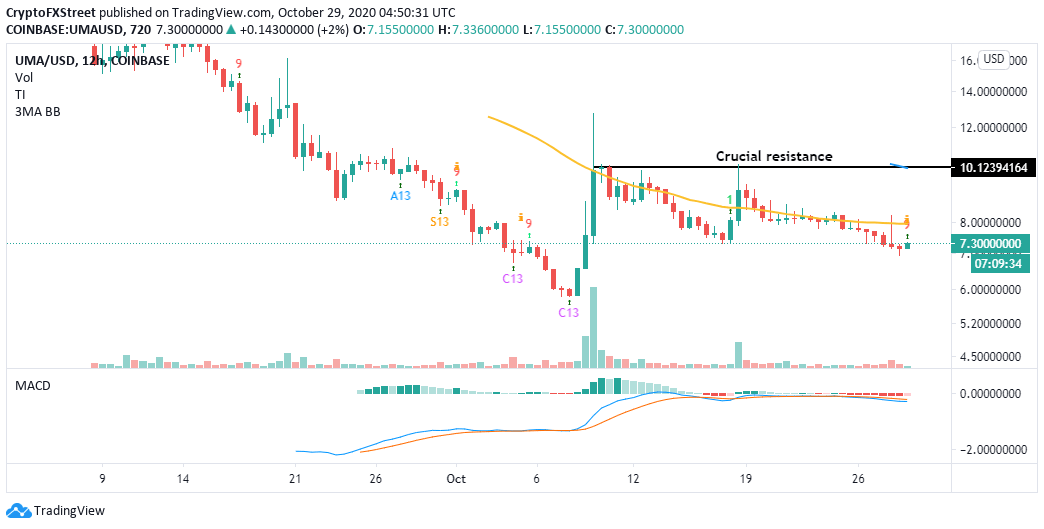
UMA/USD 12-hour chart
The lack of substantial resistance up to $8 also validates the bullish outlook, as shown by IntoTheBlock's IOMAP model. It is relatively smooth sailing until the price hits the barrier at $8.10-$8.31. Here, 187 addresses previously purchased nearly 1.1 million UMA.
-637395465810113786.png)
UMA IOMAP chart
On the downside, support highlighted between $6.8 and $7 would absorb most of the selling pressure in case of a reversal. Previously, 137 addresses purchased approximately 331,000 UMA in the range.
Looking at the other side of the fence
It is worth mentioning that UMA's transaction volume, which aggregates all the transactions on the network, has gone down significantly from the peak of roughly 490,000 UMA on October 9. According to Santiment, the transaction volume has declined to approximately 85,000 UMA at the time of writing.
 [08.03.59, 29 Oct, 2020]-637395464291796230.png)
UMA transaction volume/daily active addresses chart
Simultaneously, a dip in the daily active addresses shows that UMA is experiencing a downtrend in network growth. A correlation between the daily active addresses and the transaction volume illustrates the possibility of prices either stalling or resuming the downtrend. In other words, as long as the two metrics fall side by side, the discussed bullish outlook may be invalidated.
Author

John Isige
FXStreet
John Isige is a seasoned cryptocurrency journalist and markets analyst committed to delivering high-quality, actionable insights tailored to traders, investors, and crypto enthusiasts. He enjoys deep dives into emerging Web3 tren


