Tron Price Analysis: TRX/USD is worryingly narrowing with a tribular structure formation
- Tron price on Thursday nursing losses of some 0.80% in the latter part of the session.
- Daily chart view shows the price narrowing within a triangular pattern, subject to potential breakout south.
Tron price late on Thursday is trading in negative territory, holding losses of some 0.80%. TRX/USD is now heading for its second consecutive session in the red. It is also worth of note that the price is currently running at three straight weeks of losses.
It was announced that the Malta-based exchange OKEx’s customer-to-customer (C2C) market has further expanded, now supporting Tron (TRX). They accommodate fiat-to-cryptocurrency trading, which is done via peer-to-peer level. It already supports the following fiat currencies; the fiat currencies of the British Pound (GBP), Chinese Renminbi (CNY), Vietnamese Dong (VND), Russian Ruble (RUB) and Thai Baht (THB).
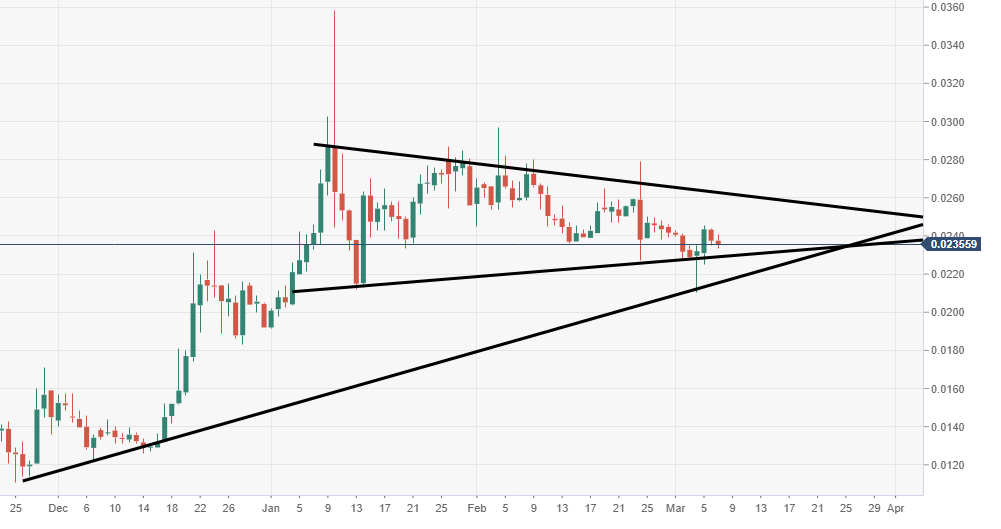
TRX/USD price action is narrowing via the daily chart view, within a triangular pattern structure. A potential breakout is nearing, as the price heads towards the end of formation. Immediate support should be noted down at $0.02180, the lower acting trend line. Resistance to the upside noted at $0.02606.
TRX/USD daily chart
Author

Ken Chigbo
Independent Analyst
Ken has over 8 years exposure to the financial markets. He started his career as an analyst, covering a variety of asset classes; forex, fixed income, commodities and equities.


