Tron price action is going for three in a row, but watch out for the joker
- Tron price action stages a firm come back with over 4% gains for the week.
- TRX price action finds itself trading away from the 55-day SMA.
- Expect to see a possible rally toward $0.066, but the ECB could interfere with those plans.

Tron (TRX) price action is set up for the third day of gains in what looks to be a winning streak. The rally bounced off the monthly pivot on Tuesday and looked to hold more upside potential based on an assessment of the daily chart. With a big economic event this afternoon in the form of the ECB meeting, the risk is that dollar strength could come back and push price action back below $0.062.
TRX price could see dollar bulls coming back into the market today
Tron price action has performed a very nice bullish breakout above the 55-day Simple Moving Average (SMA) which kept price action capped at each previous attempt last week. It was not until Tuesday that a daily close was finally performed above it, and since then, TRX price action has been trading away from the 55-day SMA. More upside, at least to the monthly R1, looks granted, but expect to see some resistance at that level.
TRX price action could, however, see its rally cut short if price action and markets overall roll over following the ECB meeting. The Frankfurt-based institution has many questions to answer and blanks to fill as markets are concerned about the rate spreads between the core eurozone countries and the periphery. If the ECB drops the ball on that topic again, expect dollar bulls to come in hard and see EURUSD back below parity, with cryptocurrencies dropping like a stone.
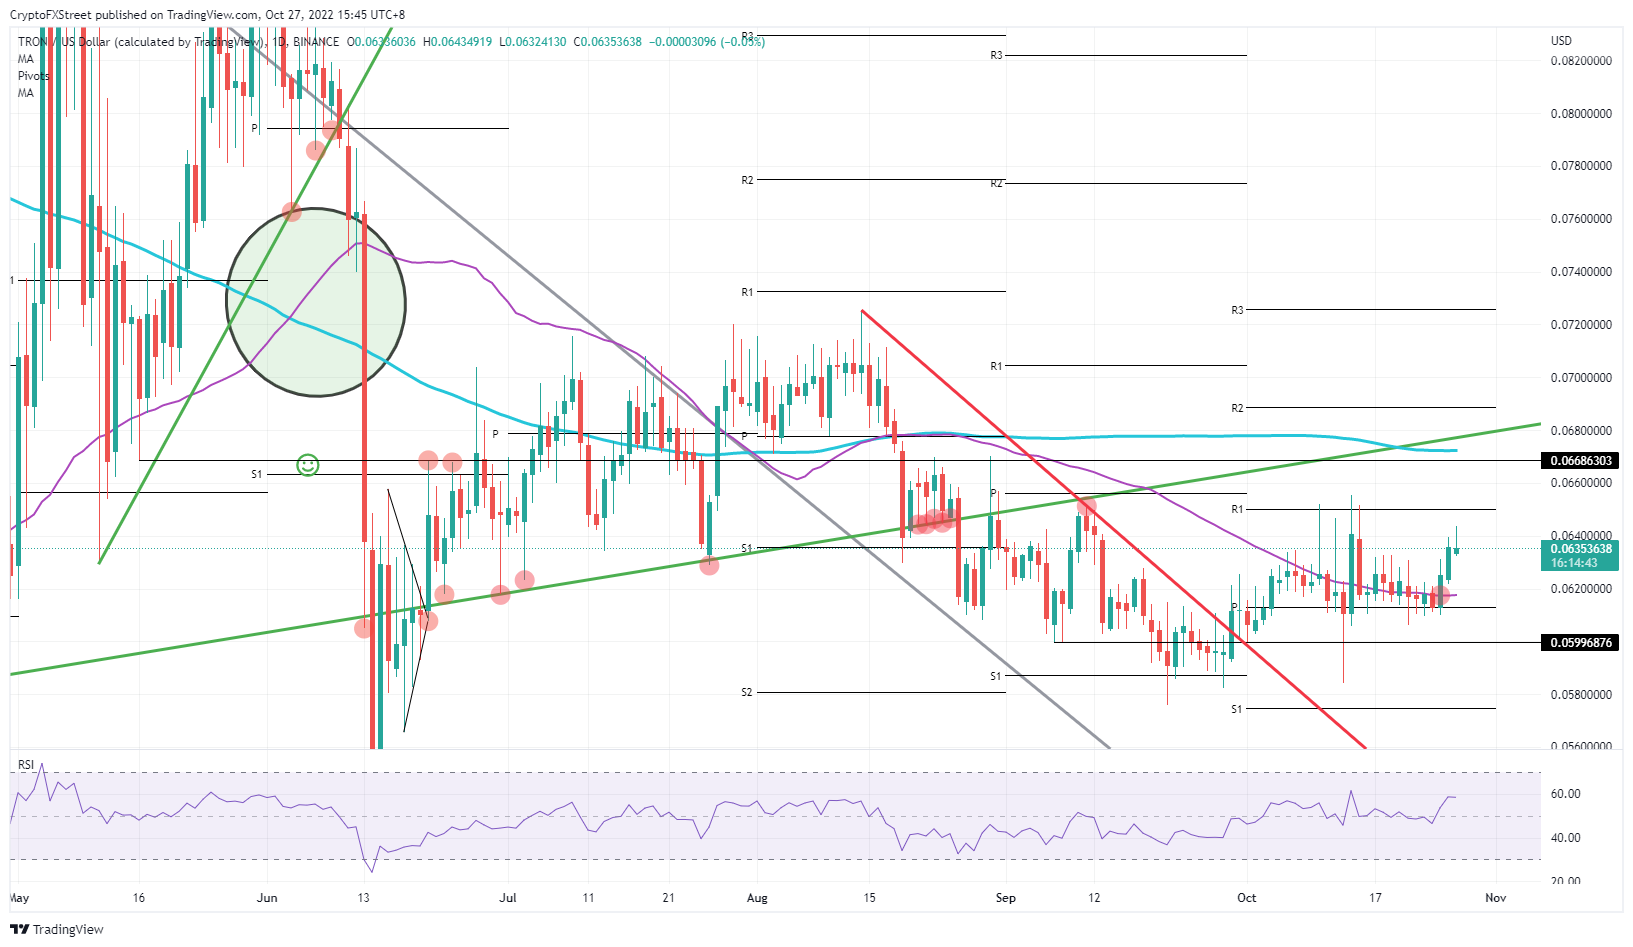
TRX/USD Daily chart
Should the ECB go ahead with the expected 75 bps hike and deliver a strong message or install a program that will address the spreads in the eurozone specifically, that would lead to the euro getting underpinned and open up more room for dollar weakness to follow. Expect TRON price to test that $0.066 and possibly break above the 200-day SMA. Even the longer-term green ascending trend line comes back into play and could see support at $0.0068 with room to move towards $0.078 by the end of November as dollar bulls find themselves contained.
Author

Filip Lagaart
FXStreet
Filip Lagaart is a former sales/trader with over 15 years of financial markets expertise under its belt.


