Top 3 Price Prediction Bitcoin, Ethereum, XRP: Cryptos build momentum for a flash crash
- Bitcoin price approaches the lowest daily close in almost 18 months.
- Ethereum price, likewise, approaches the lowest close it has seen in nearly 10 months.
- XRP price is on the path to $0.25

Bitcoin price shows bears are attempting to put BTC into a close last seen in early January 2021. Ethereum price threatens to create a new lowest 2022 and 10-month close. XRP price action tested the $0.50 as resistance but could not break it.
Bitcoin price continues to slide south
Bitcoin price action during the NY trading session has been decidedly weak. As risk-on markets across the globe show renewed selling, BTC has followed suit. As a result, nearly all of the gains made from last Friday's (May 13) close have been eliminated. As a result, bears could push BTC to the lowest close since January 1, 2021.
The only immediate support structure for Bitcoin on the daily chart is the Tenkan-Sen – which has a marked slope down. Bulls have made several attempts to maintain a daily close above the Tenkan-Sen over the past five days, but results have been mixed.
If bulls want to mitigate any further near-term bearish price action, Bitcoin price will need to close at or above the high volume node in the 2022 Volume Profile at $31,700. If that scenario comes true, then the path to $40,000 becomes much easier because the volume profile is between $31,700 and $40,000.
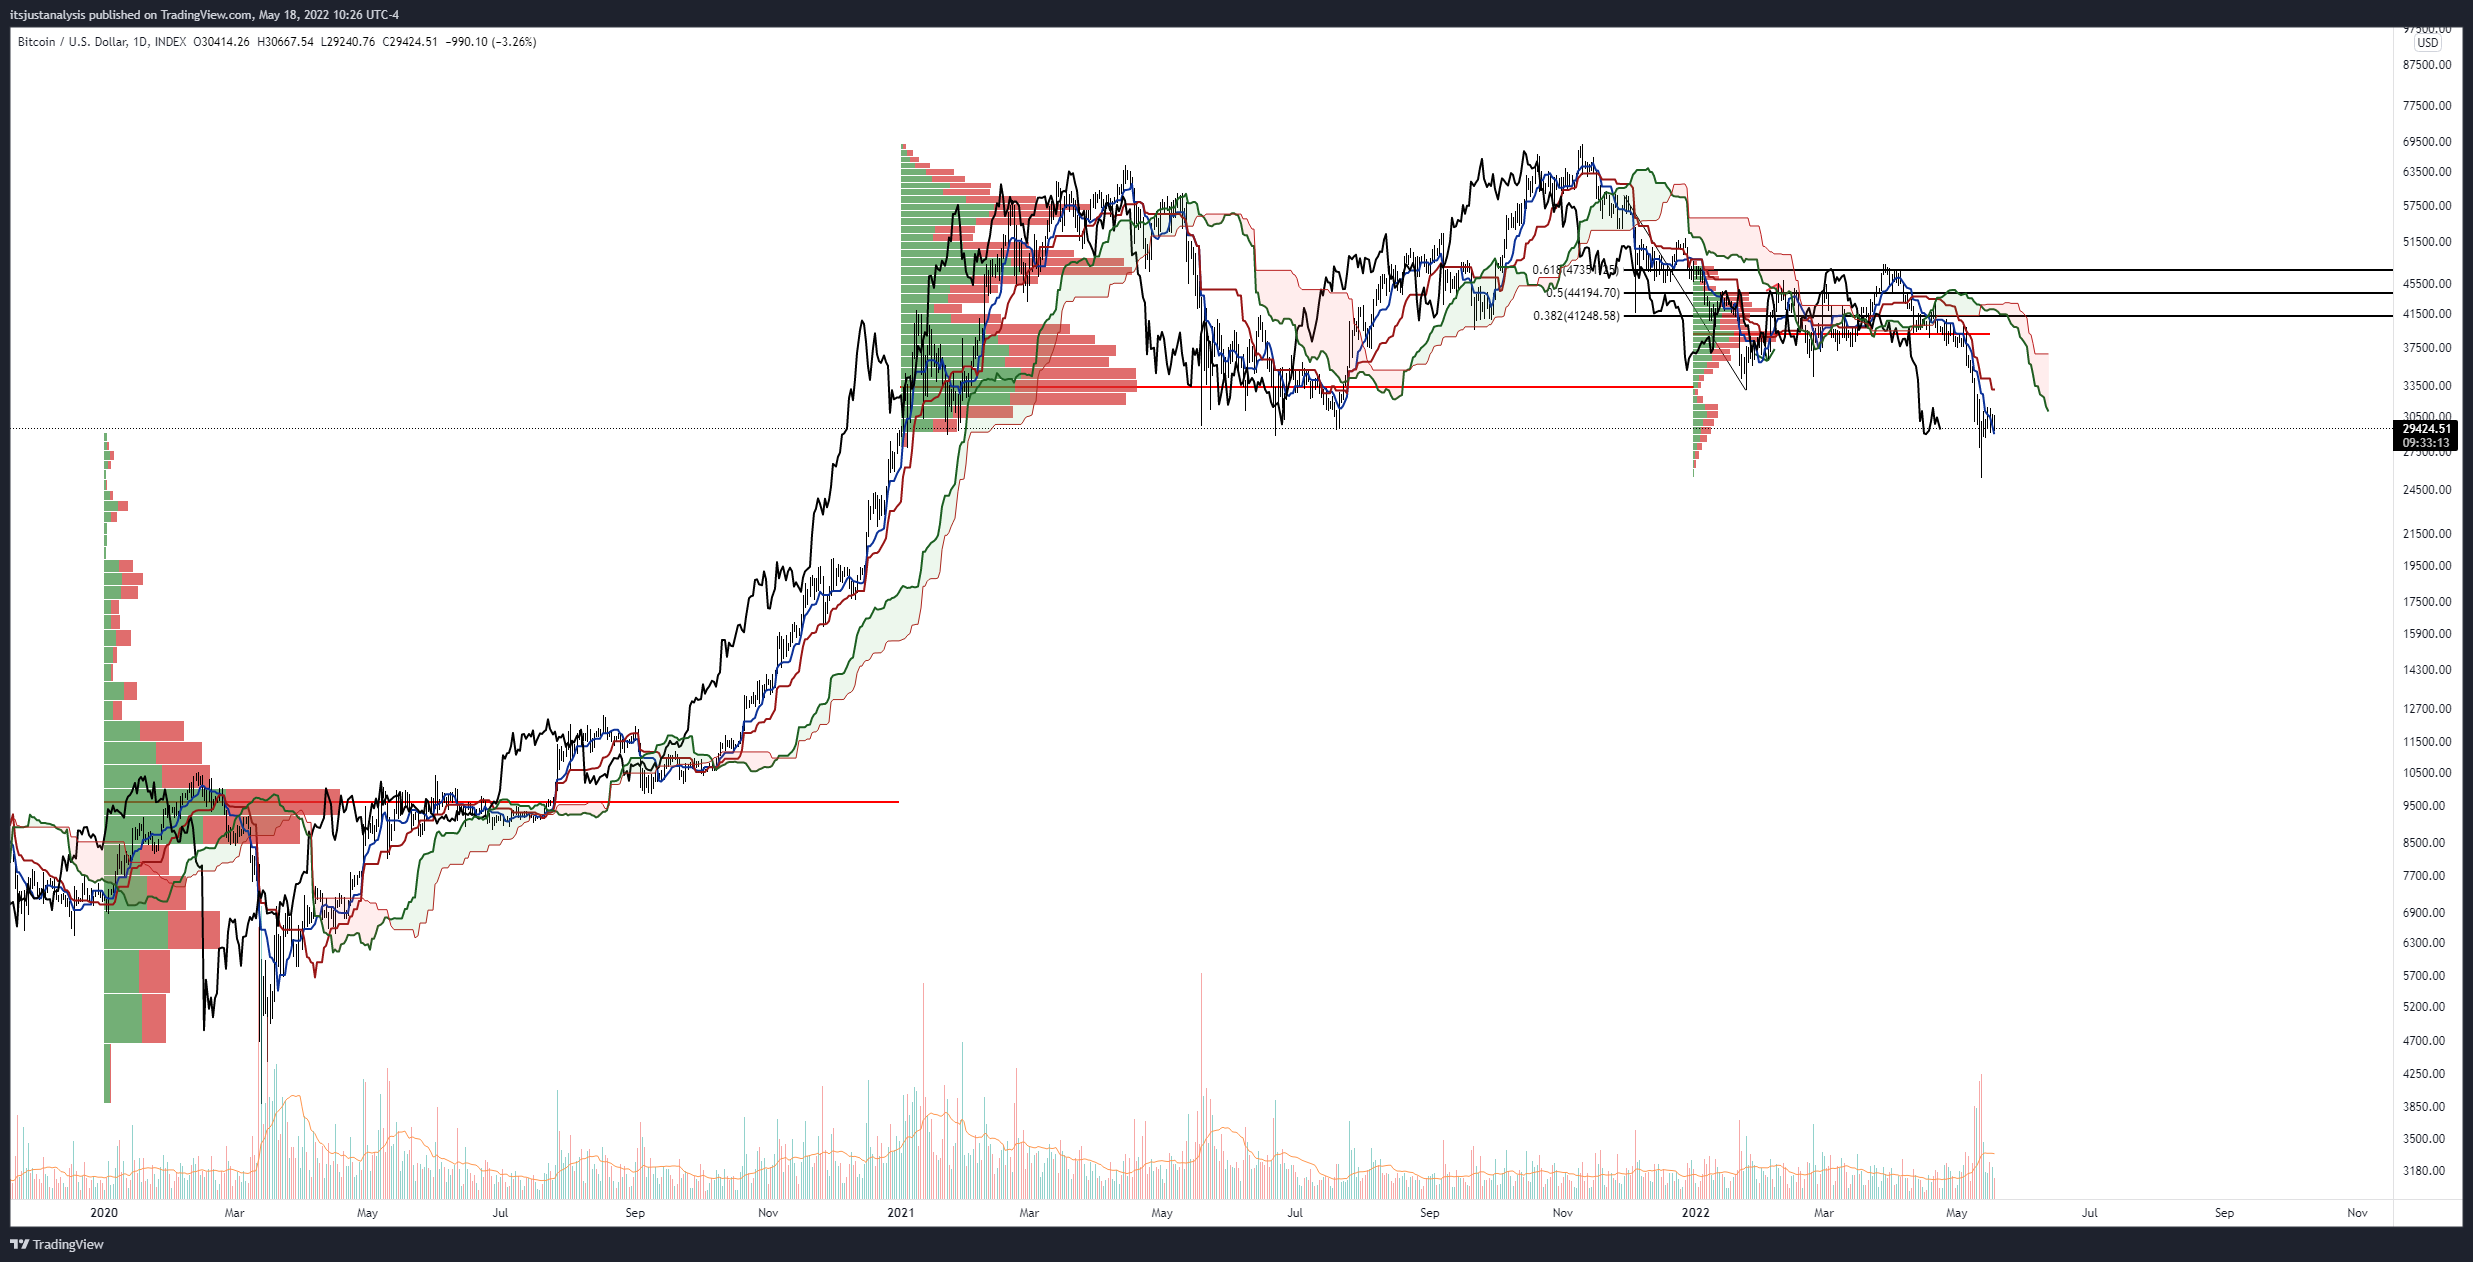
BTC/USD Daily Ichimoku Kinko Hyo Chart
Downside risks for Bitcoin price may be substantial. Below the 2021 and 2022 lows is a near-total absence of traded price action. However, the next high-volume node does not appear until the 2020 Volume Profile near $22.500. And below that, $19,000. Even further is the 2020 Volume Point of Control at $10,000.
A chart worth looking at now is the Crypto Total Market Cap from TradingView, which measures all cryptocurrencies' total market cap value. Note the massive gap in the 2021 Volume Profile between $1.29 Trillion and the next high volume node at $1 Trillion. So another flash crash may be just around the corner.
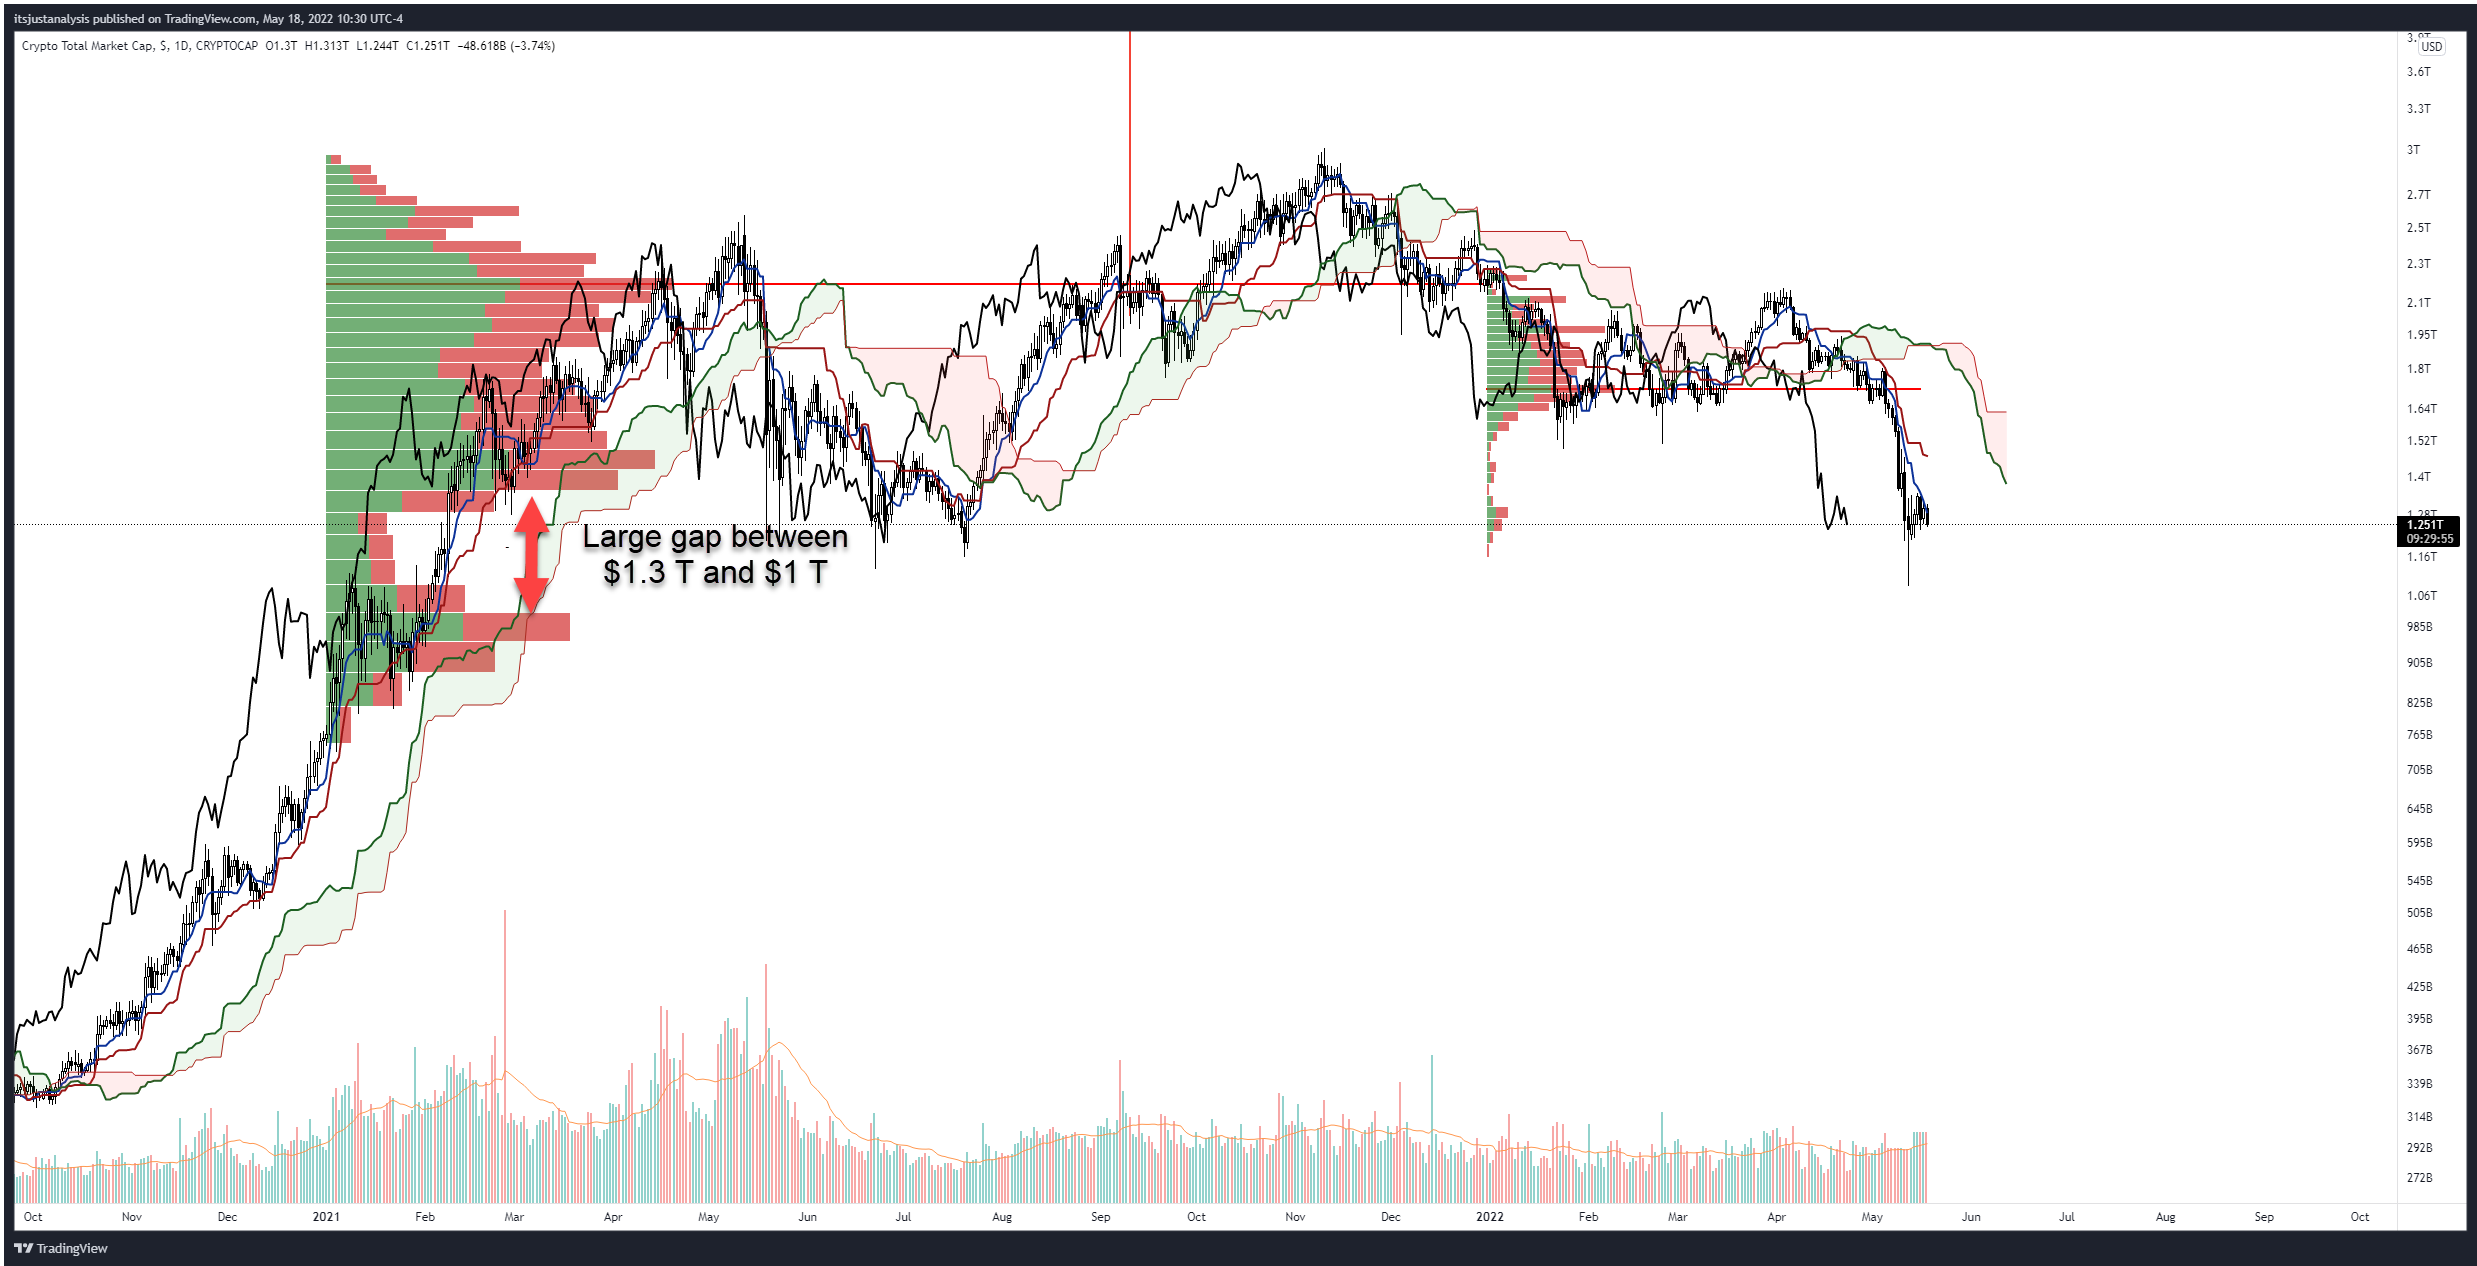
Crypto Total Market Cap Daily Ichimoku Kinko Hyo Chart
Ethereum price action has wiped out all of the gains from the weekend
Ethereum price follows Bitcoin and the broader market on another run to the basement. At the time of writing, ETH is down over 5% and is on track to print a bearish engulfing candlestick on the daily chart. The bearish engulfing candlestick and rejection against the daily Tenkan-Sen give short-sellers a powerful reason to add to their short positions.
There is no more Ichimoku support on the daily or weekly timeframes for Ethereum price. The next major support level for ETH doesn’t appear until the $1,200 - $1,400 value area, which contains the 38.2% Fibonacci retracement (1,420), the 2021 Volume Point of Control ($1,270), and the 361.8% Fibonacci expansion ($1,202).
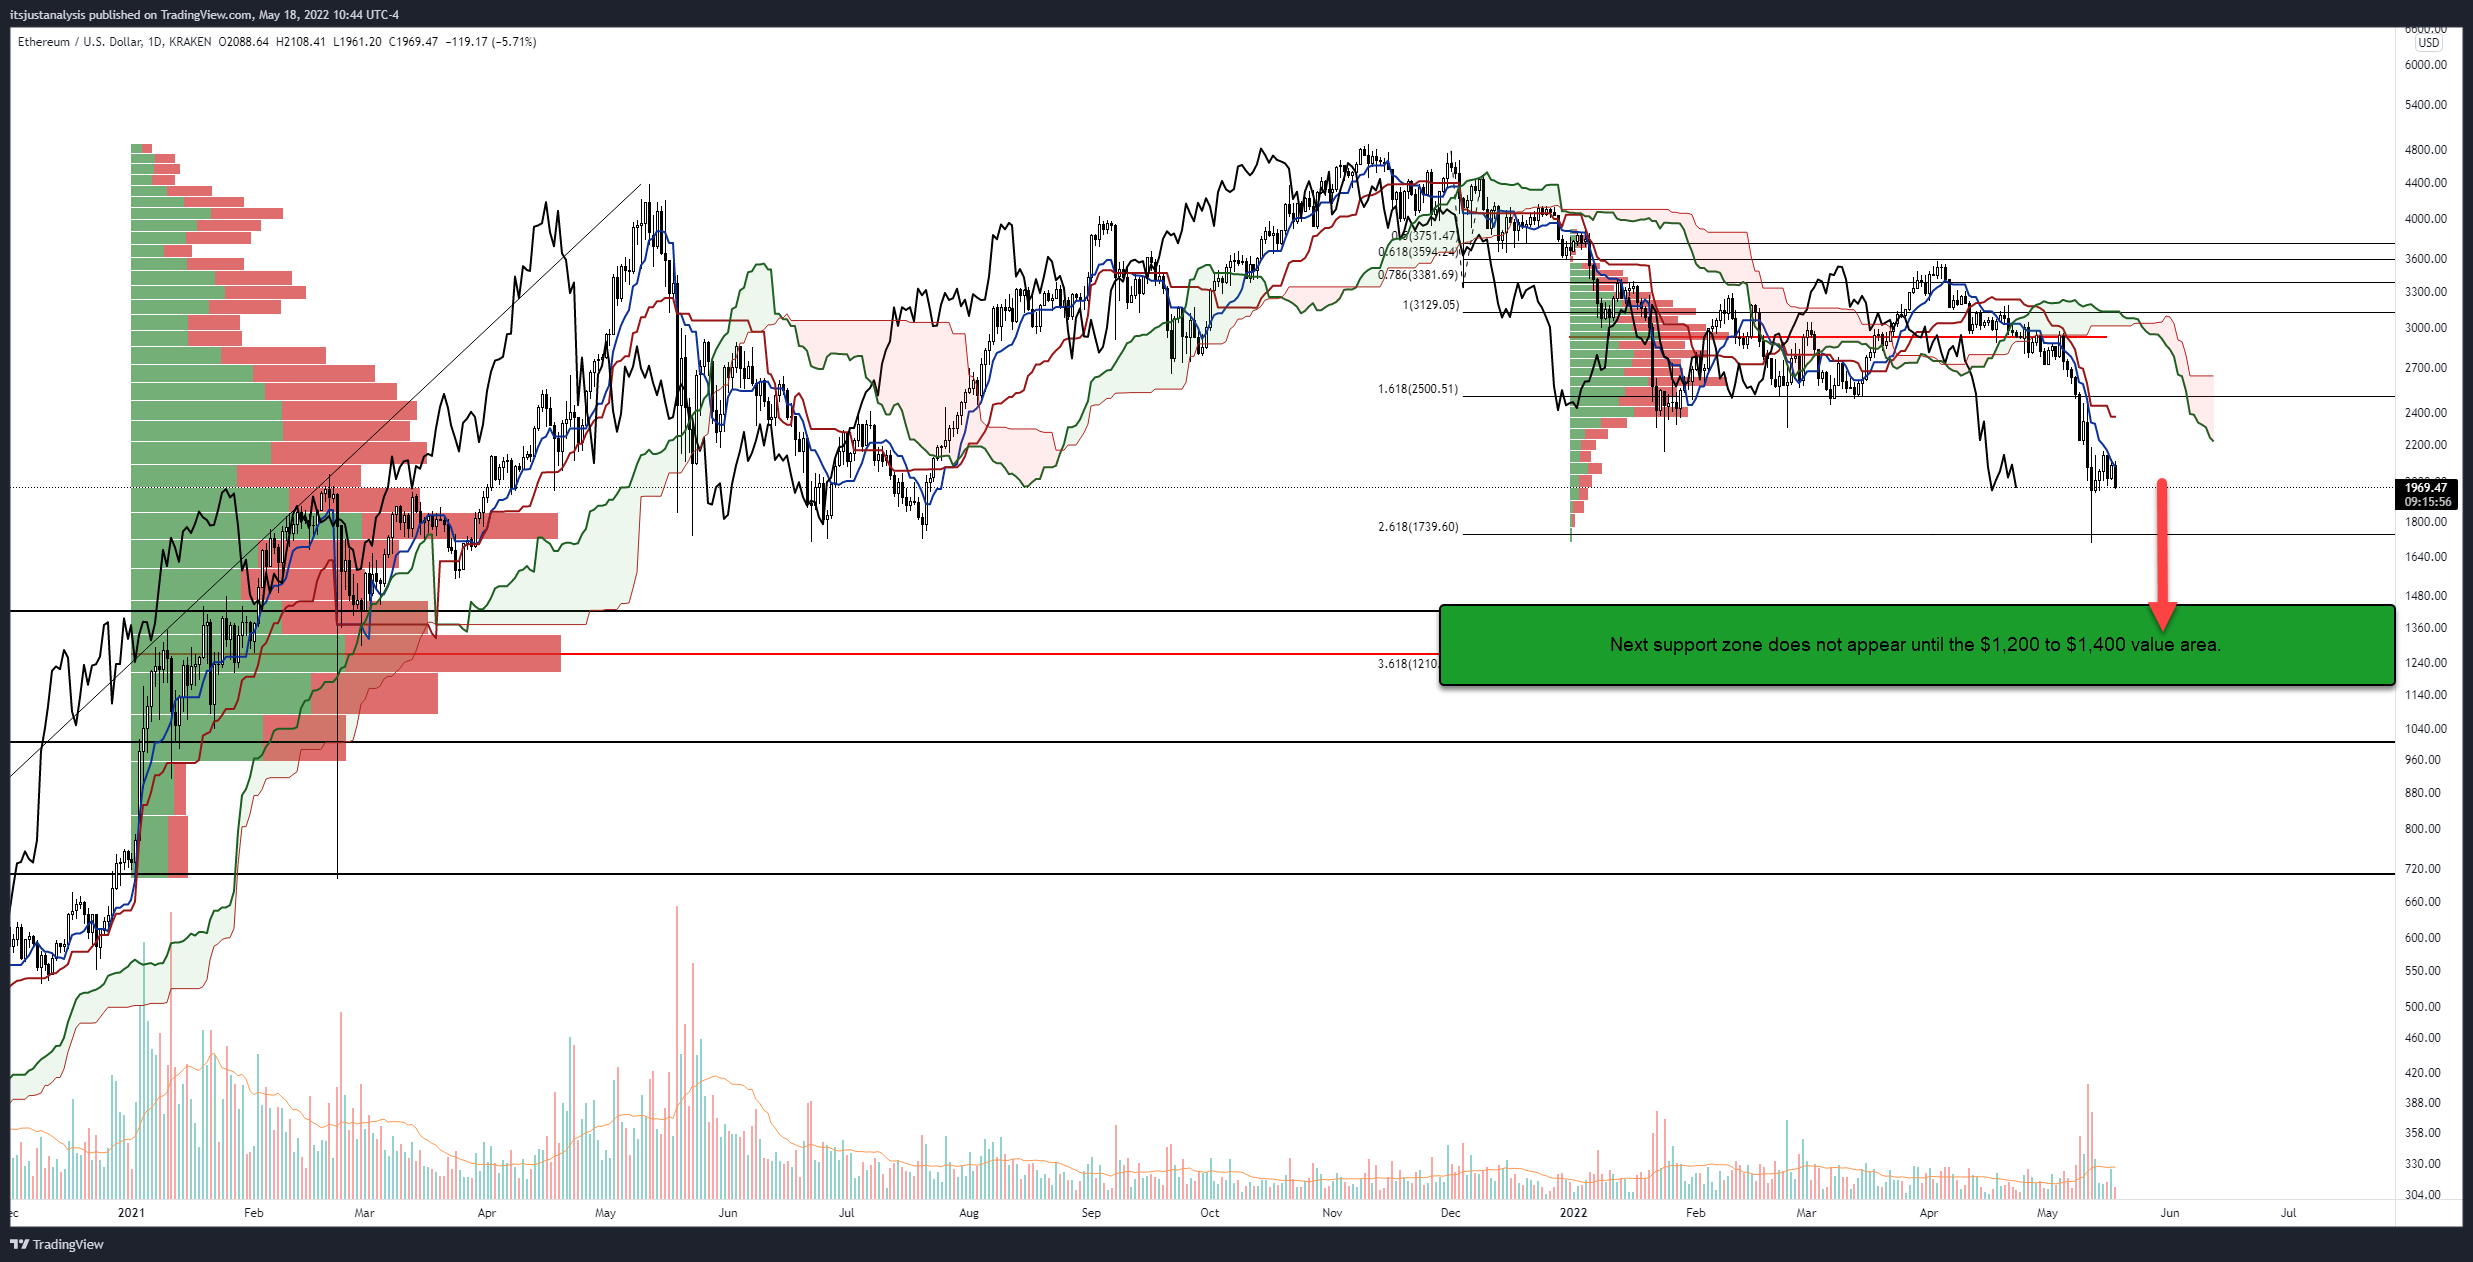
ETH/USD Daily Ichimoku Kinko Hyo Chart
Upside potential is unlikely, but if a fakeout south does occur, then upside momentum will likely be limited to the daily Kijun-Sen near $2,300.
XRP price likely to return to $0.25
XRP price has spent the past week making several attempts to recover the losses it experienced last week and return above one of the most powerful resistance levels on its price chart: the 2021 Volume Point of Control at $0.45. Unfortunately, bulls have been unable or unwilling to crack that resistance.
Bears, smelling blood in the water and sensing broad and continued weakness, have piled into new short positions against crypto and XRP. As a result, XRP price faces another nearly 50% wipe in value as it approaches the 2020 Volume Point of Control at $0.25, which is the final near-term support for XRP. After that, however, buyers may step in to halt further downside movement around the $0.30 price range. Both the 2020 and 2021 Volume Profiles have high volume nodes a the $0.30 level.
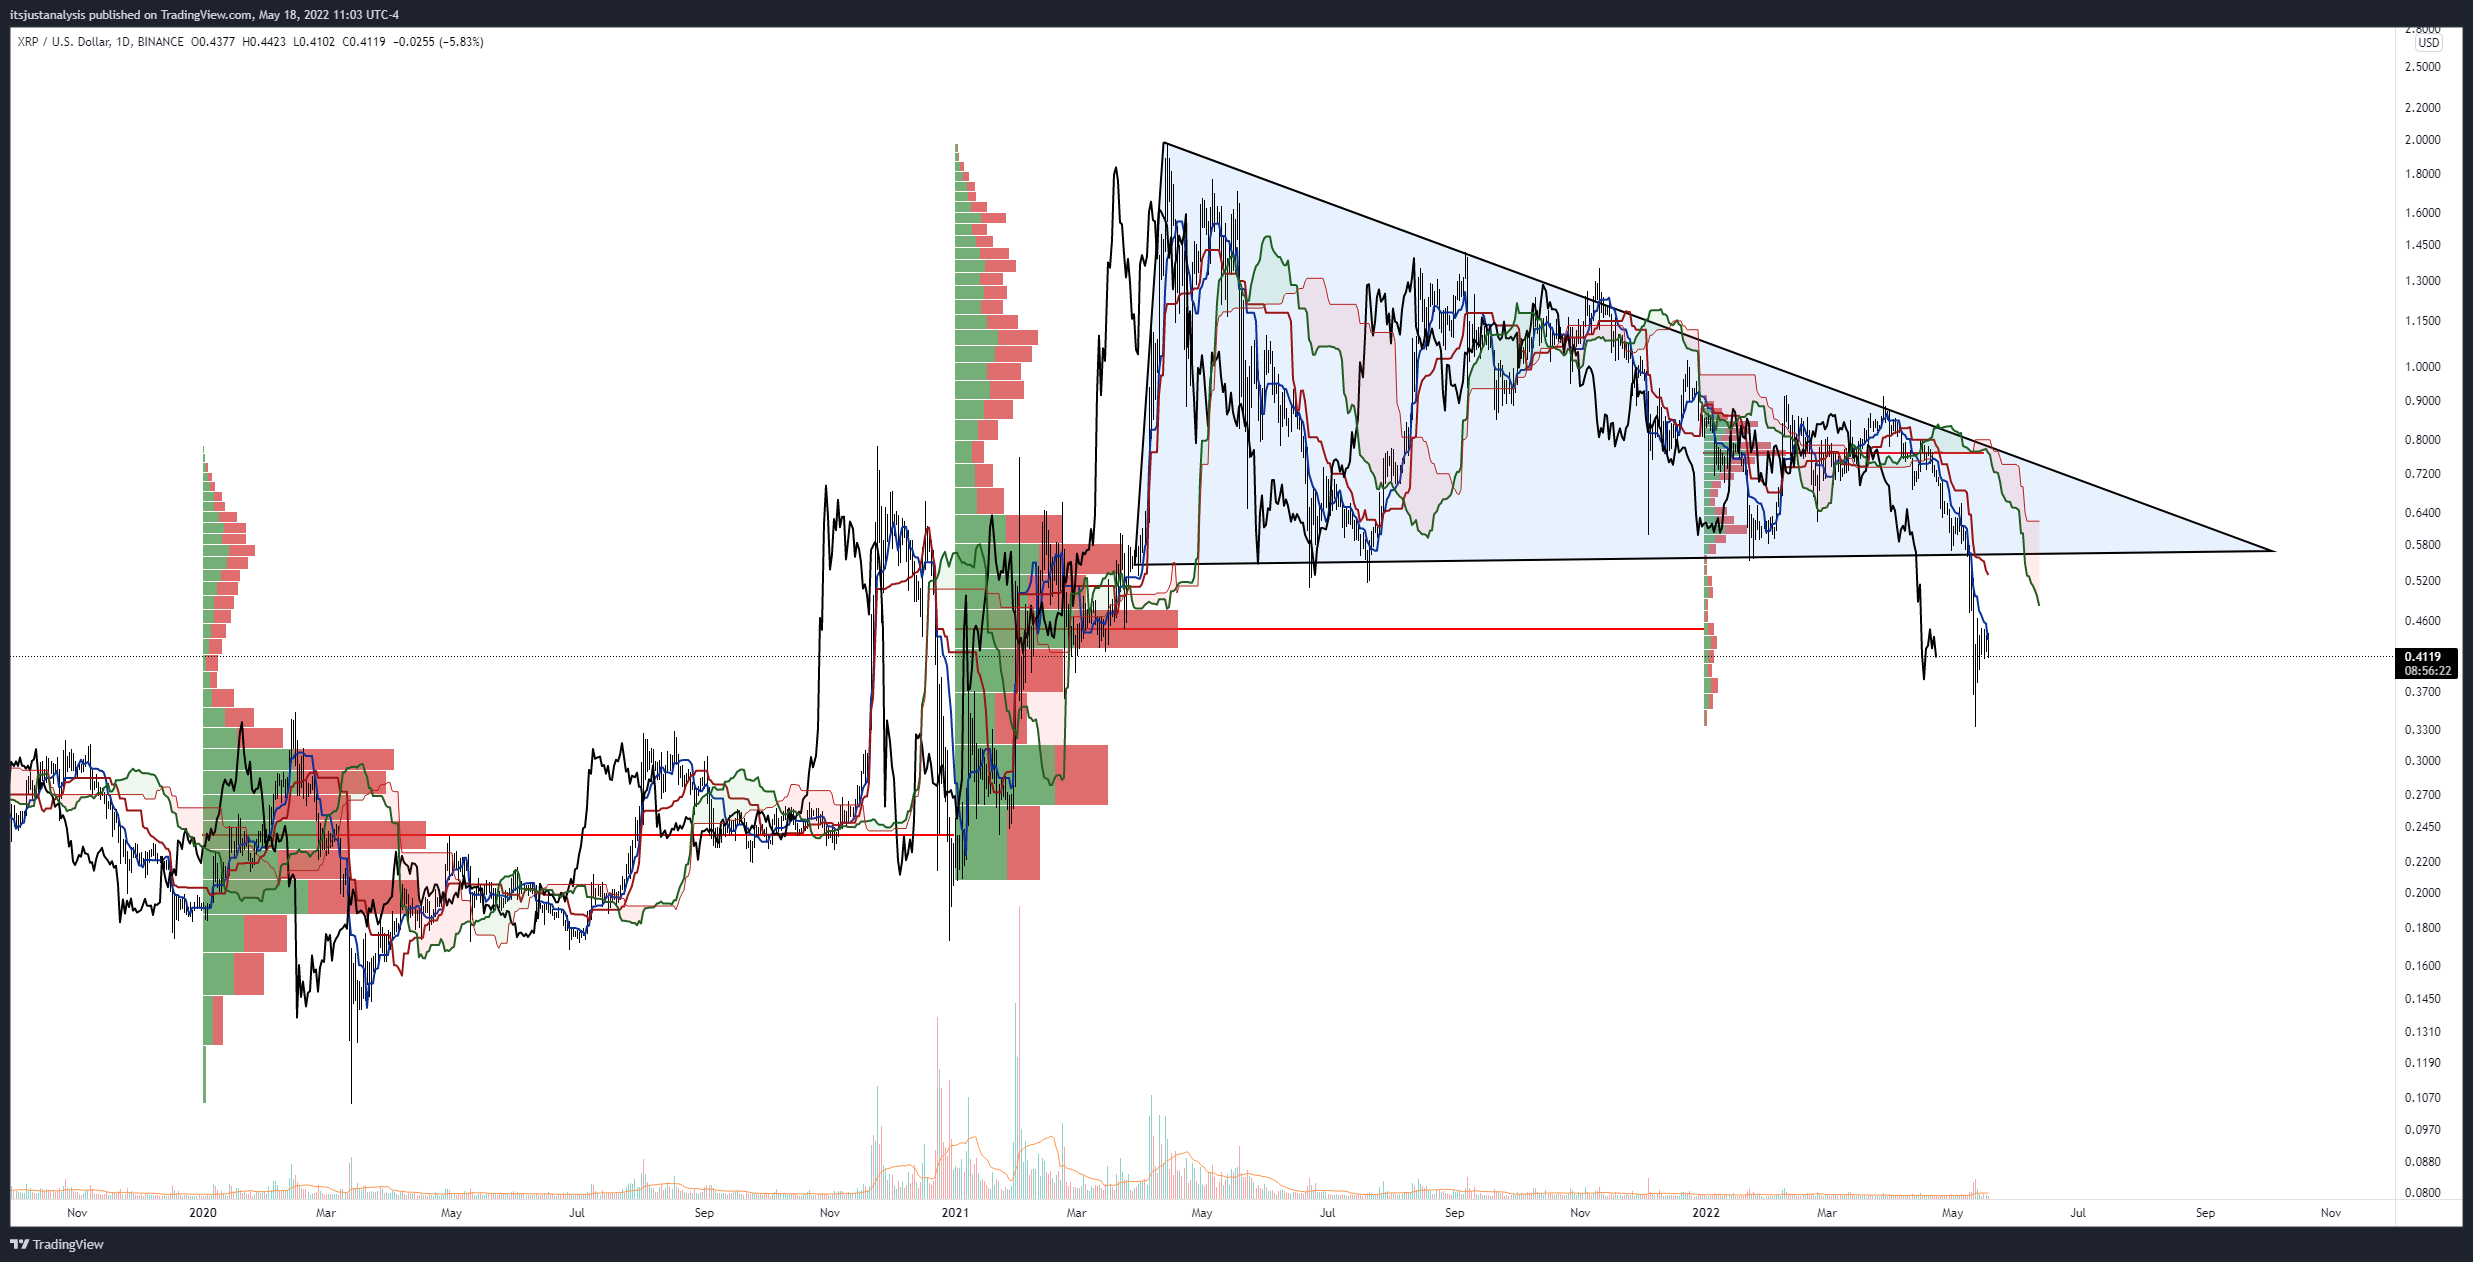
XRP/USD Daily Ichimoku Kinko Hyo Chart
Any upside potential, unlikely as it is, would likely be limited to the daily Kijun-Sen and the bottom of the prior descending triangle in the $0.55 value area.
Author

Jonathan Morgan
Independent Analyst
Jonathan has been working as an Independent future, forex, and cryptocurrency trader and analyst for 8 years. He also has been writing for the past 5 years.



