Why Ethereum price at $600 seems more plausible than $3,000
- Ethereum price has flipped bearish from a macro perspective after creating a second lower low at $1,700.
- Investors should be prepared for a worst-case scenario that puts ETH at $600.
- A three-day candlestick close above $3,396 will invalidate the bearish thesis.

Ethereum price is in a tough spot despite the recent crash and indicates that a further downtrend is on the cards. The case for a bullish trend will only be revived after ETH produces a higher high from a macro perspective. From a fundamental point of view, increasing competition has recently capped Ethereum blockchain upside, but user share dominance and further cycle improvements allow for high upside.
Mixed views on Ethereum on "State of Crypto" report
With this regard, in a recent report on the “2022 State of Crypto,” popular tech VC firm a16z outlined its views on Ethereum and its leadership. The report by the Sillicon Valley company states that "users are willing to pay an average of $15 million in gas fees per day despite the massive number of competitor blockchains." Additionally, this a16z report mentioned how this popularity is a “double-edged sword” as the Ethereum blockchain has always preferred decentralization over “security,” allowing other layer-2 scaling solutions to siphon its user share with the allure of “better performance and lower fees.”
Also read: Can Ethereum price hold as Vitalik Buterin sells 30,000 ETH?
According to a16z, "other developers of blockchains like Solana, Polygon, BNB Chain, Avalance, and Fantom are angling for similar success."
Ethereum has far and away the most builders, with nearly 4,000 monthly active devs. Next is Solana with nearly 1,000 and Bitcoin at about 500.
— a16z (@a16z) May 17, 2022
Ethereum’s overwhelming mindshare helps explain why users have been willing to pay more than $15M in gas fees a day on average. pic.twitter.com/pBGywymKtz
Ethereum price remains bearish on a higher time frame
Ethereum price set an all-time high at $4,868 on November 10, 2021 after a 579% year-to-date gain. This impressive rally faced two major sell-offs: the first crash pushed ETH down by 55% and set a swing low at $2,160. The second leg knocked the smart contract token by 52% and set a lower low at $1,700. This development since the all-time high is a clear indication of a downtrend with distinctive lower highs and lower lows. Since this trend is occurring on a macro time frame, it indicates that ETH and larger crypto markets are in a bear market.
For now, the Ethereum price is bouncing off the $1,730 support floor which also happens to be the high volume node of the 2021 volume profile. While there is a pause from the sell-off, a failure to set a higher high could further trigger another crash that could shatter the $1,730 barrier. In such a case, ETH price could slide to the next stable barrier – $1,260, coinciding with 2021’s second high volume node. This is the second most significant level that could serve as a potential reversal zone with the ability to trigger an uptrend.
While an upswing from this level might be possible, what lies below this level is extremely critical and is the best zone for dollar-cost averaging or buying spot ETH. Assuming sellers shatter the $1,260 barrier, the 2020 and 2021 volume profile shows that there is a massive gap extending from $911 to $595 – termed “The Void.”Within this area also lies the fair value gap, aka price inefficiency, that extends up to $661. Therefore, the confluence of these levels around $661 is where long-term investors could blindly accumulate ETH. This is because the risk of a sell-off around the levels mentioned is extremely low.
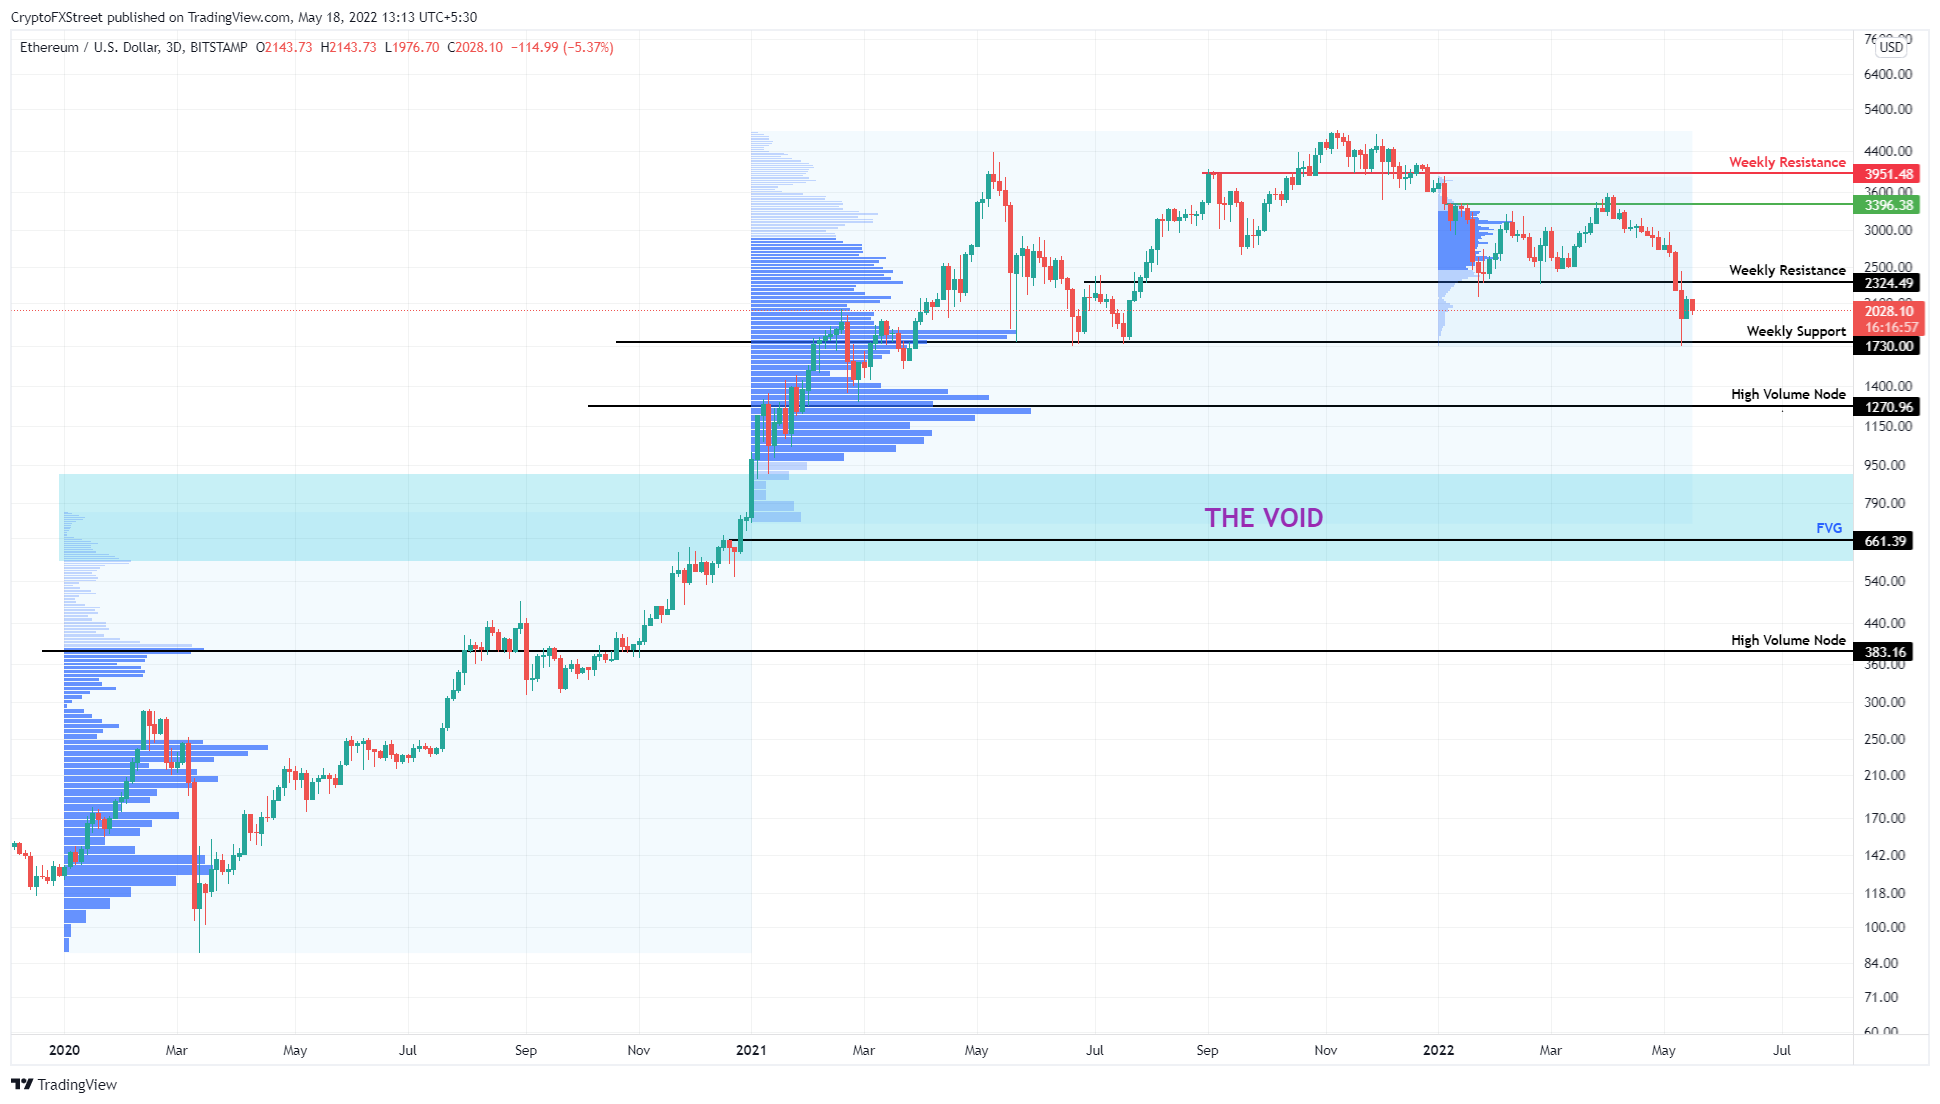
ETH/USD 1-day chart
Supporting this lower move in Ethereum price is the Net Unrealized Profit/Loss metric. This index is essentially the difference between ETH holders with relative unrealized profit and relative unrealized loss. Another way of understanding this metric is that it is the difference between the realized market capitalization and the actual market capitalization. The relative unrealized profit or loss is obtained by noting the difference between the unrealized spent transaction output (UTXO) and the value of the holdings at the current price level.
As seen in the chart, the bottom for each cycle occurred when the NUPL dipped into negative territory. The 2018 and 2019 bear markets bottomed when the NUPL was between 0 to -1. Currently, the NUPL for Ethereum price is hovering around 0.19, which indicates that a further descent in price action is likely.
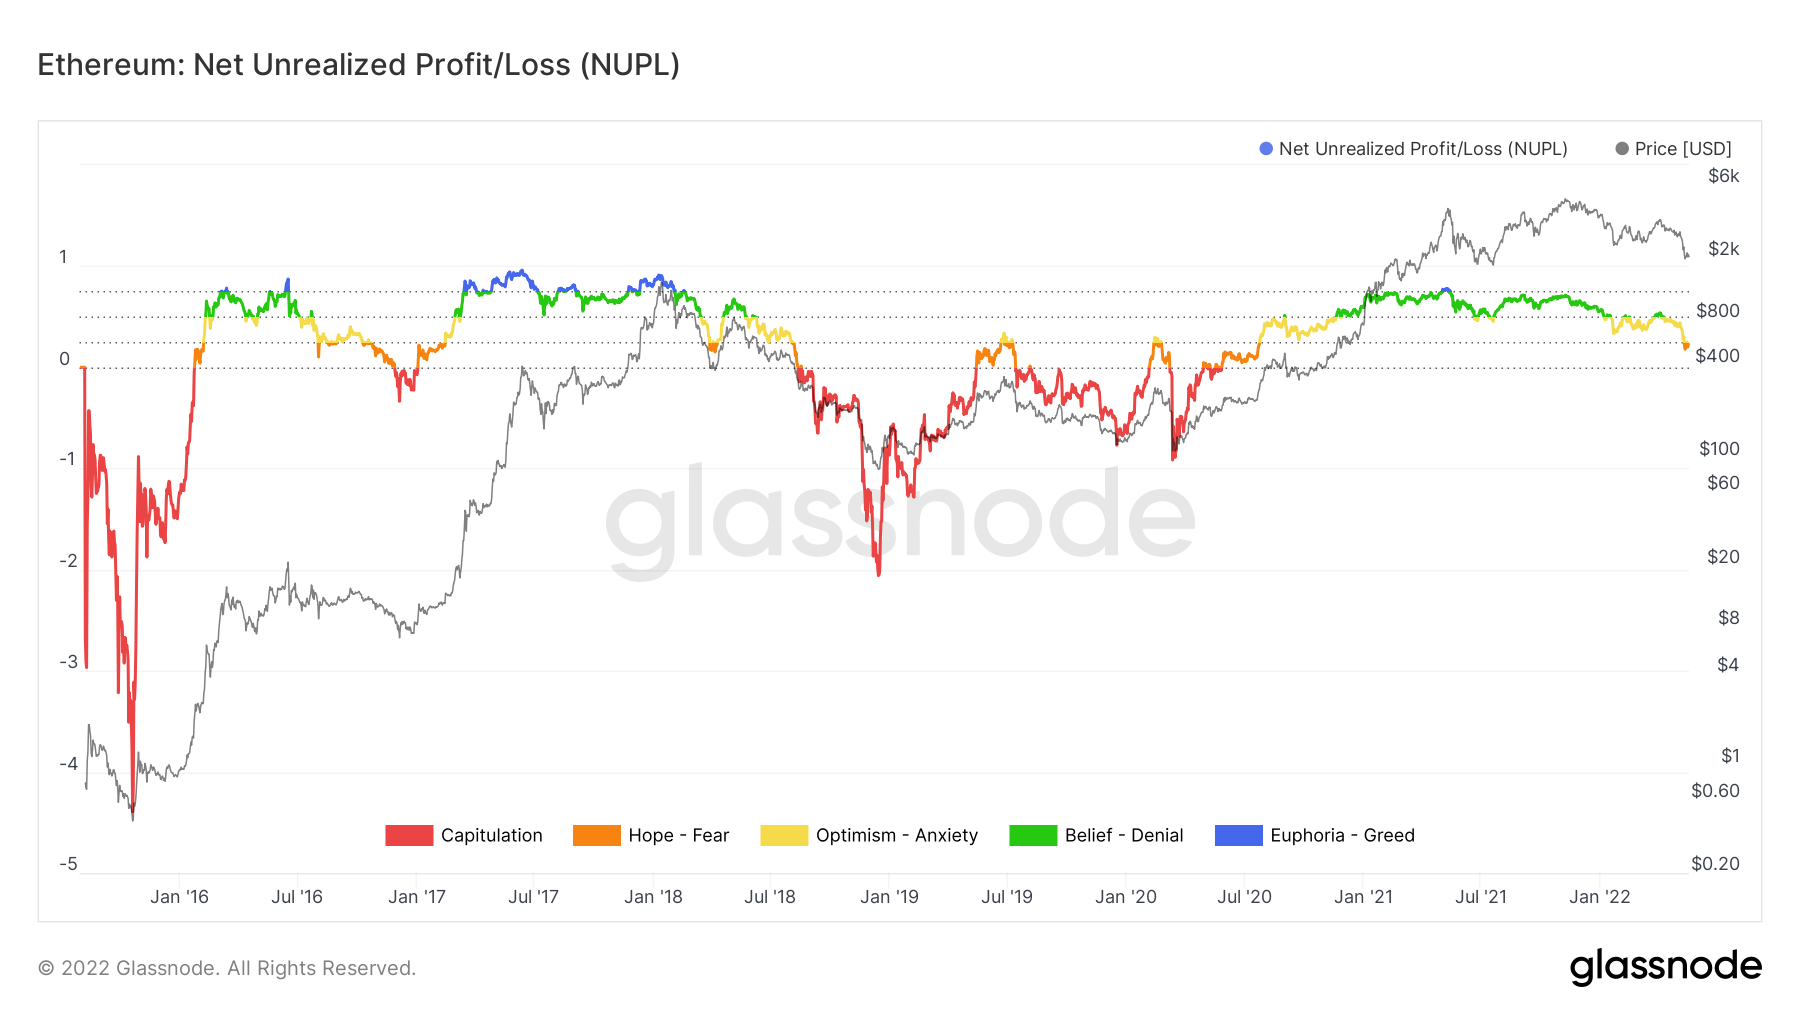
ETH NUPL
Lastly, the Market Value to Realized Value (MVRV) Z-score for Ethereum also supports the idea of a steeper correction. This on-chain metric is used to assess when Ethereum is over/undervalued relative to its "fair value.” Based on historical data, the green band, extending from 0 to -0.61, is where ETH bottomed before in 2016 and where the altcoin is highly undervalued or at a discounted price. Likewise, the red band, extending from 7 to 8.5 is where historical tops are formed and is when the ETH is highly overpriced or at a premium. Therefore, a dip into the green box would be a buy signal and a move into the red box would present a sell signal.
For Ethereum, the MVRV Z-score is hovering at 0.19, indicating that the price of the second-largest cryptocurrency should dive deeper to signal "buy". Interestingly, both the on-chain metrics are perfectly aligned with the technical outlook, which suggests a steeper correction still to go for the smart contract token.
-637884602552443904.png)
ETH MVRV Z-score
Despite the extremely bearish outlook for Ethereum price, it makes sense from a macro perspective. Moreover, Bitcoin price also reveals its pessimistic narrative which aligns perfectly with ETH’s future. If Ethereum price produces a three-day candlestick close above $3,396, however, it will indicate a higher high from a macro perspective. This move would invalidate the bearish thesis and suggest the possibility of an uptrend to retest $4,000 or higher levels.
You can watch more on this Ethereum price technical perspective on the following clip:
Author

Akash Girimath
FXStreet
Akash Girimath is a Mechanical Engineer interested in the chaos of the financial markets. Trying to make sense of this convoluted yet fascinating space, he switched his engineering job to become a crypto reporter and analyst.


