Top 3 Price Prediction Bitcoin, Ethereum, Ripple: XRP heads to new yearly highs while the others take a backseat
- Bitcoin price could take a breather before continuing its uptrend.
- Ethereum is following Bitcoin’s footsteps as buying pressure vanes, but its bullish target is still intact.
- Ripple shows a massive breakout from the head-and-shoulders pattern, hinting at a climb toward $1.

The Bitcoin and Ethereum paused their trajectory as this technical indicator flashed a cycle top signal. The retracement that ensued left a lot of the over-leveraged traders liquidated. Regardless, both cryptocurrencies still have their upside target in place.
Separating itself from the consensus, Ripple saw a massive surge in bullish momentum that pushed its price 17% higher, resulting in a breakout of a bullish pattern, indicating more gains on its way.
Bitcoin price eyes minor pullback before resuming uptrend
The Bitcoin price rally seems to be contained inside an ascending parallel channel since January 8 as it created two higher highs and three lower lows.
At the time of writing, BTC seems to be limping lower due to the Momentum Reversal Indicator’s (MRI) cycle top signal presented in the form of a red one candlestick on the daily chart.
This setup forecasts a one-to-four candlestick correction. Hence, if the downtrend were to continue, the Bitcoin price would most likely head toward the support at $54,978, which coincides with the 50 Simple Moving Average (SMA) and the 78.6% Fibonacci retracement level.
A bounce from this barrier could propel the flagship cryptocurrency by 37% toward the upper trend line around $75,300, with a pitstop at the MRI’sbreakout line at $67,600.
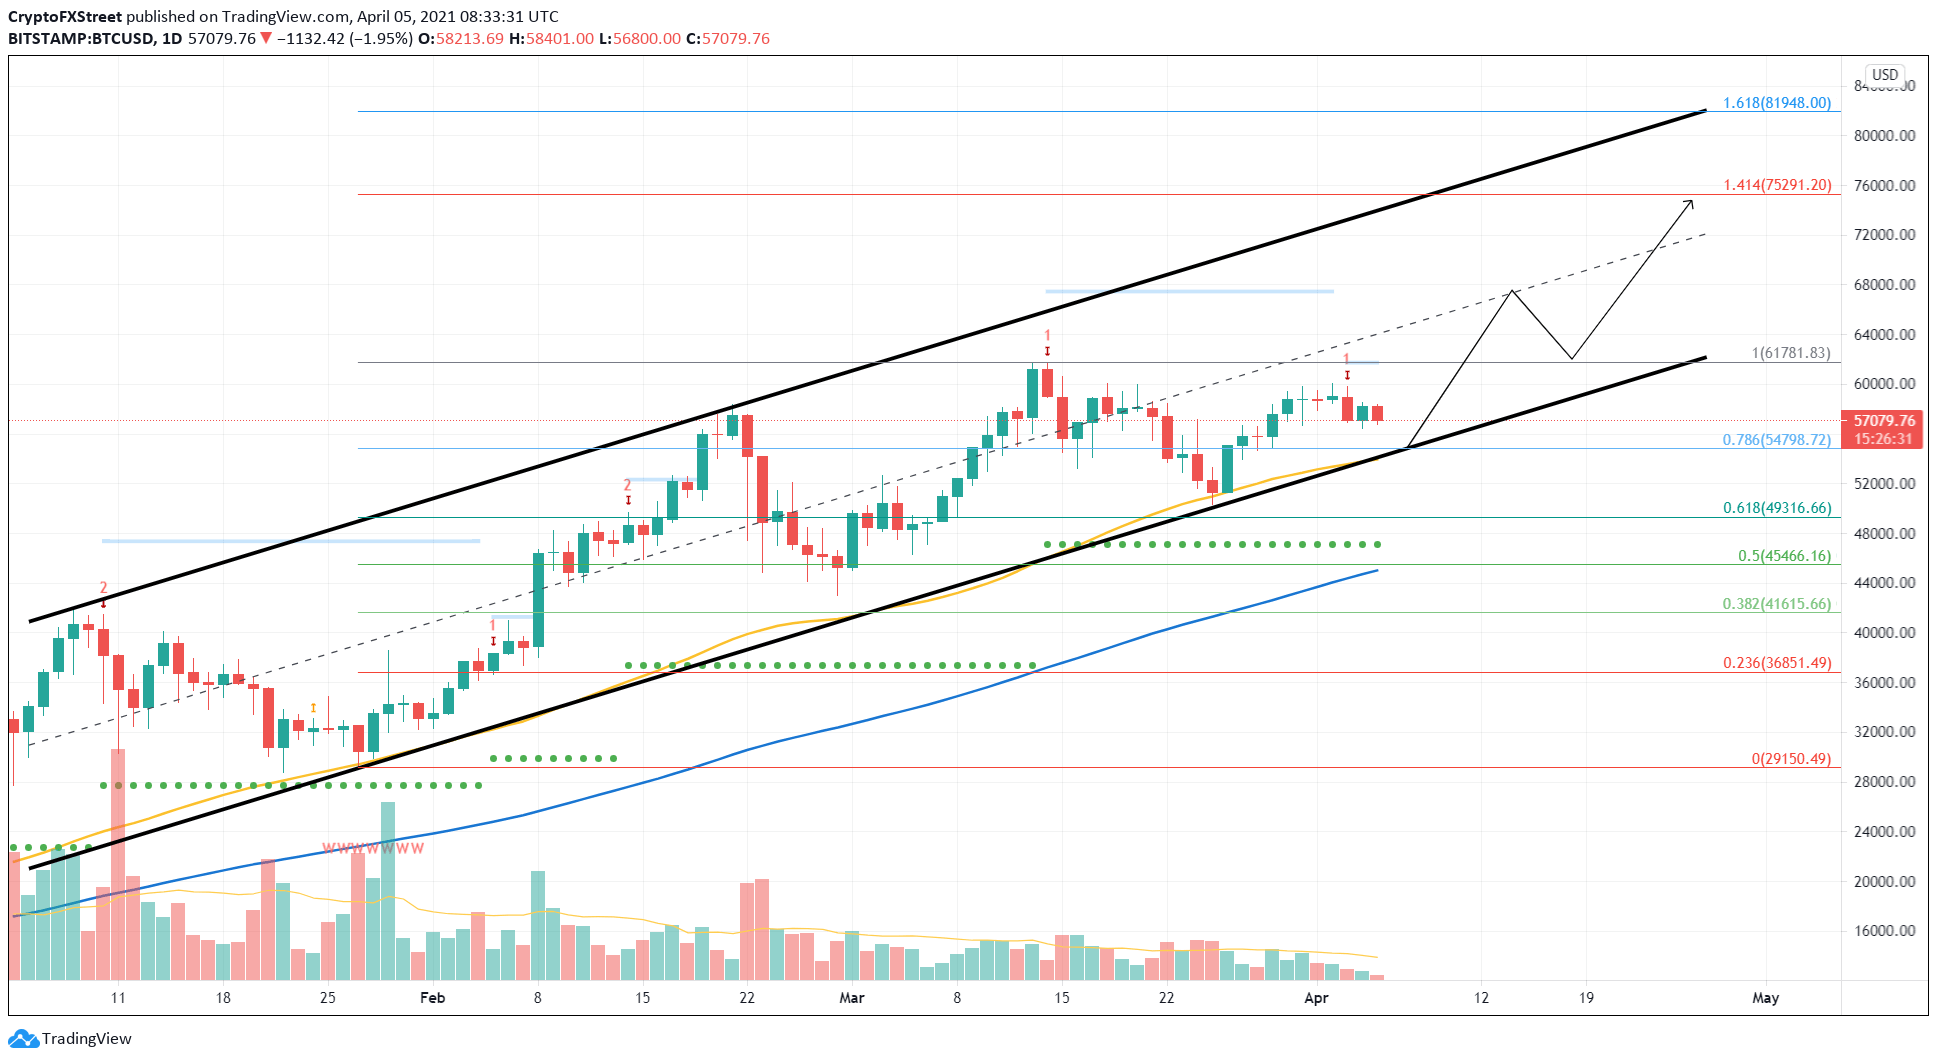
BTC/USD 1-day chart
However, if the demand barrier at $54,978 breaks down, it would signal the start of a downtrend. In which case, BTC price could drop 14% to $47,220, which intersects with the 100 SMA.
Ethereum price slows down before next leg up
Unlike Bitcoin, Ethereum created multiple lower highs and higher lows from February 20 to March 29. Such a price action forms a symmetrical triangle pattern when the swing points are connected using trend lines.
As of March 30, ETH price shattered this setup’s upper boundary, confirming a 36% upswing to $2,530. This target is determined by measuring the distance between the swing high and swing low at the broadest part of the technical formation.
Since the MRI indicator flashed a cycle top signal for the Etheruem price on April 2, this upswing faced a temporary stop. Now, ETH awaits accumulation before continuing its rally to $2,530.
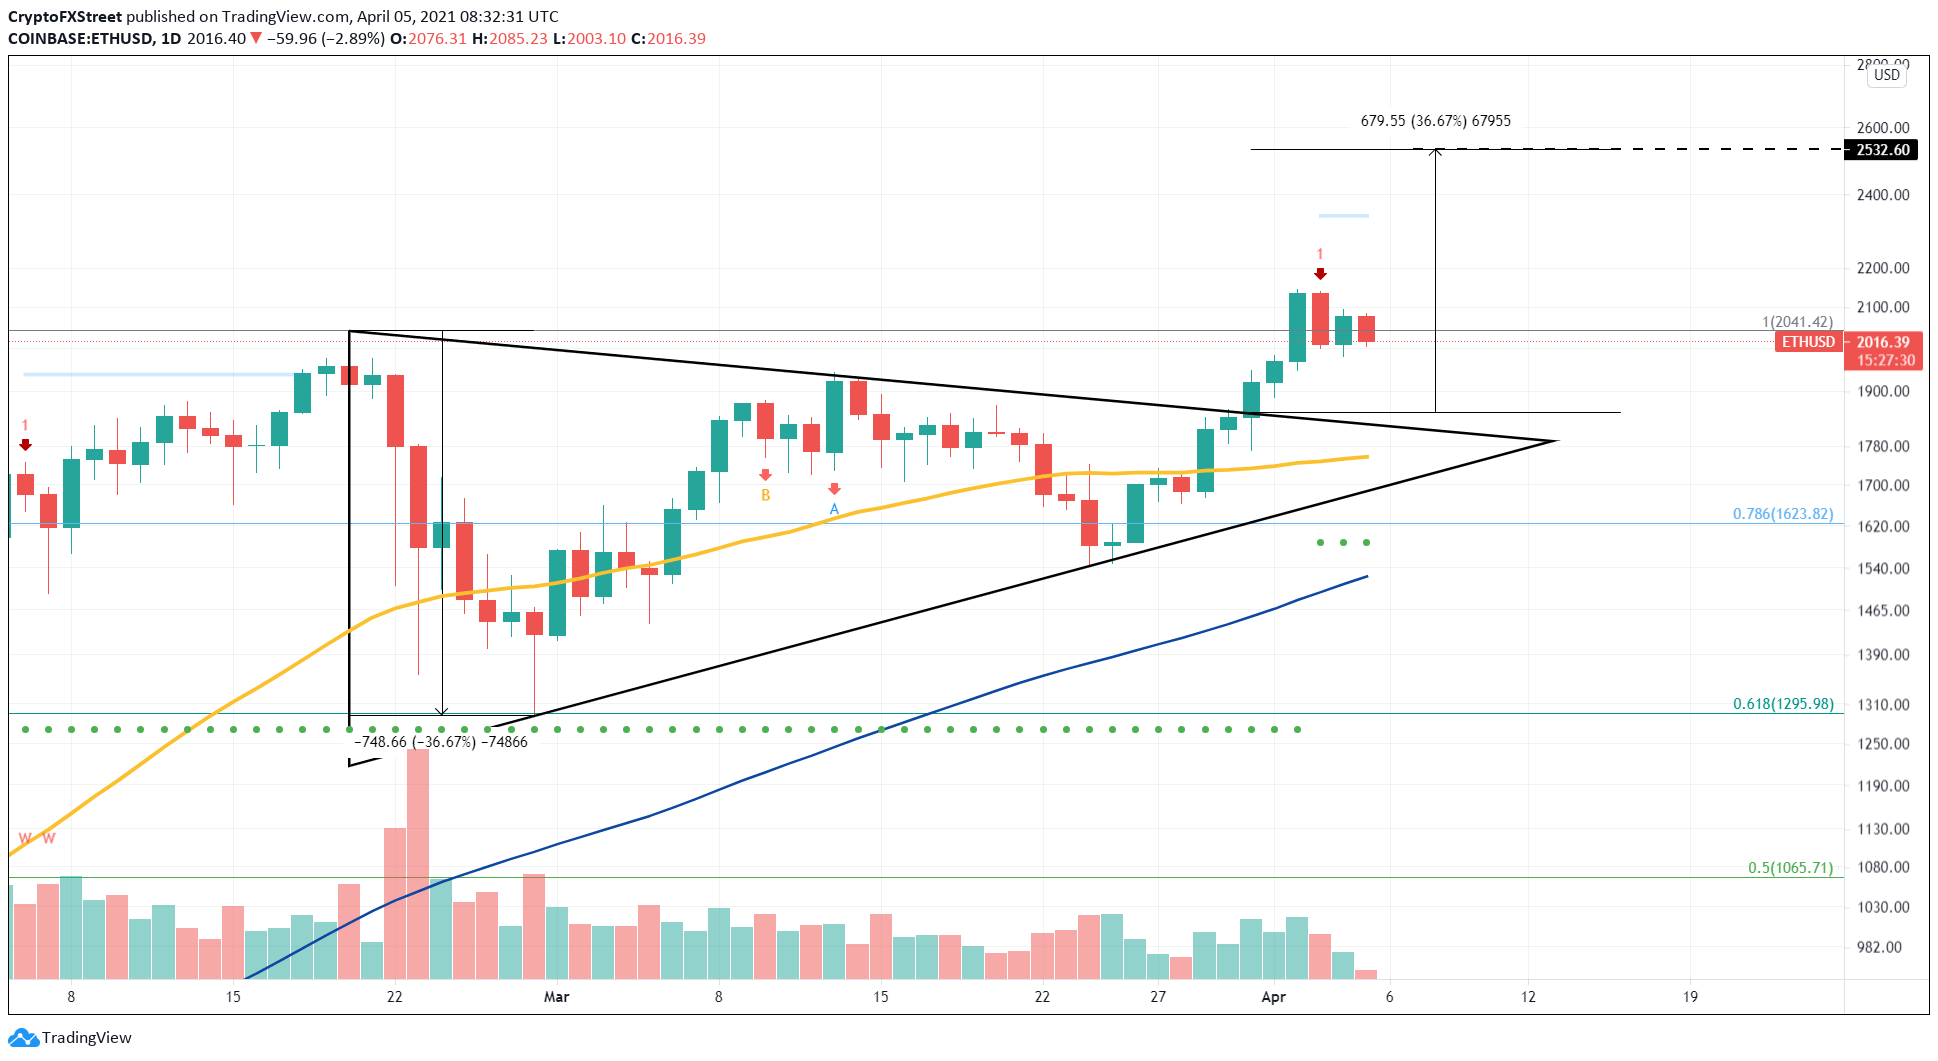
ETH/USD 1-day chart
A spike in selling pressure that pushes the Ethereum price to slice through the 50 SMA at $1,760 will signal a potential reversal in play. The turnaround will be confirmed when the bears break below the 78.6% Fibonacci retracement level at $1,620.
If this were to happen, the smart contracts platform token would collapse 6% to the 100 SMA at $1,520. Following this, a 15% crash to the immediate demand barrier at $1,300 seems likely.
Ripple price eyes $1 as buyers come out of the woodwork
While BTC and ETH saw their momentum diminish, the Ripple price revealed a massive pump that led to a breakout of the head-and-shoulders pattern.
XRP price created three bottoms with the extreme ones, known as “shoulders,” which are of comparable depths. However, the middle one is referred to as “head” and is lower than the rest. The peaks of all these dips faced rejection around a common supply barrier at $0.63, known as “neckline.”
This setup forecasts a 73% upswing, determined by adding the distance between the head’s bottom to the neckline. Adding this measure to $0.63 reveals a target of $1.09.
As of Monday, a spike in buying pressure has caused a breakout of the neckline, signaling the 73% bull rally’s start.
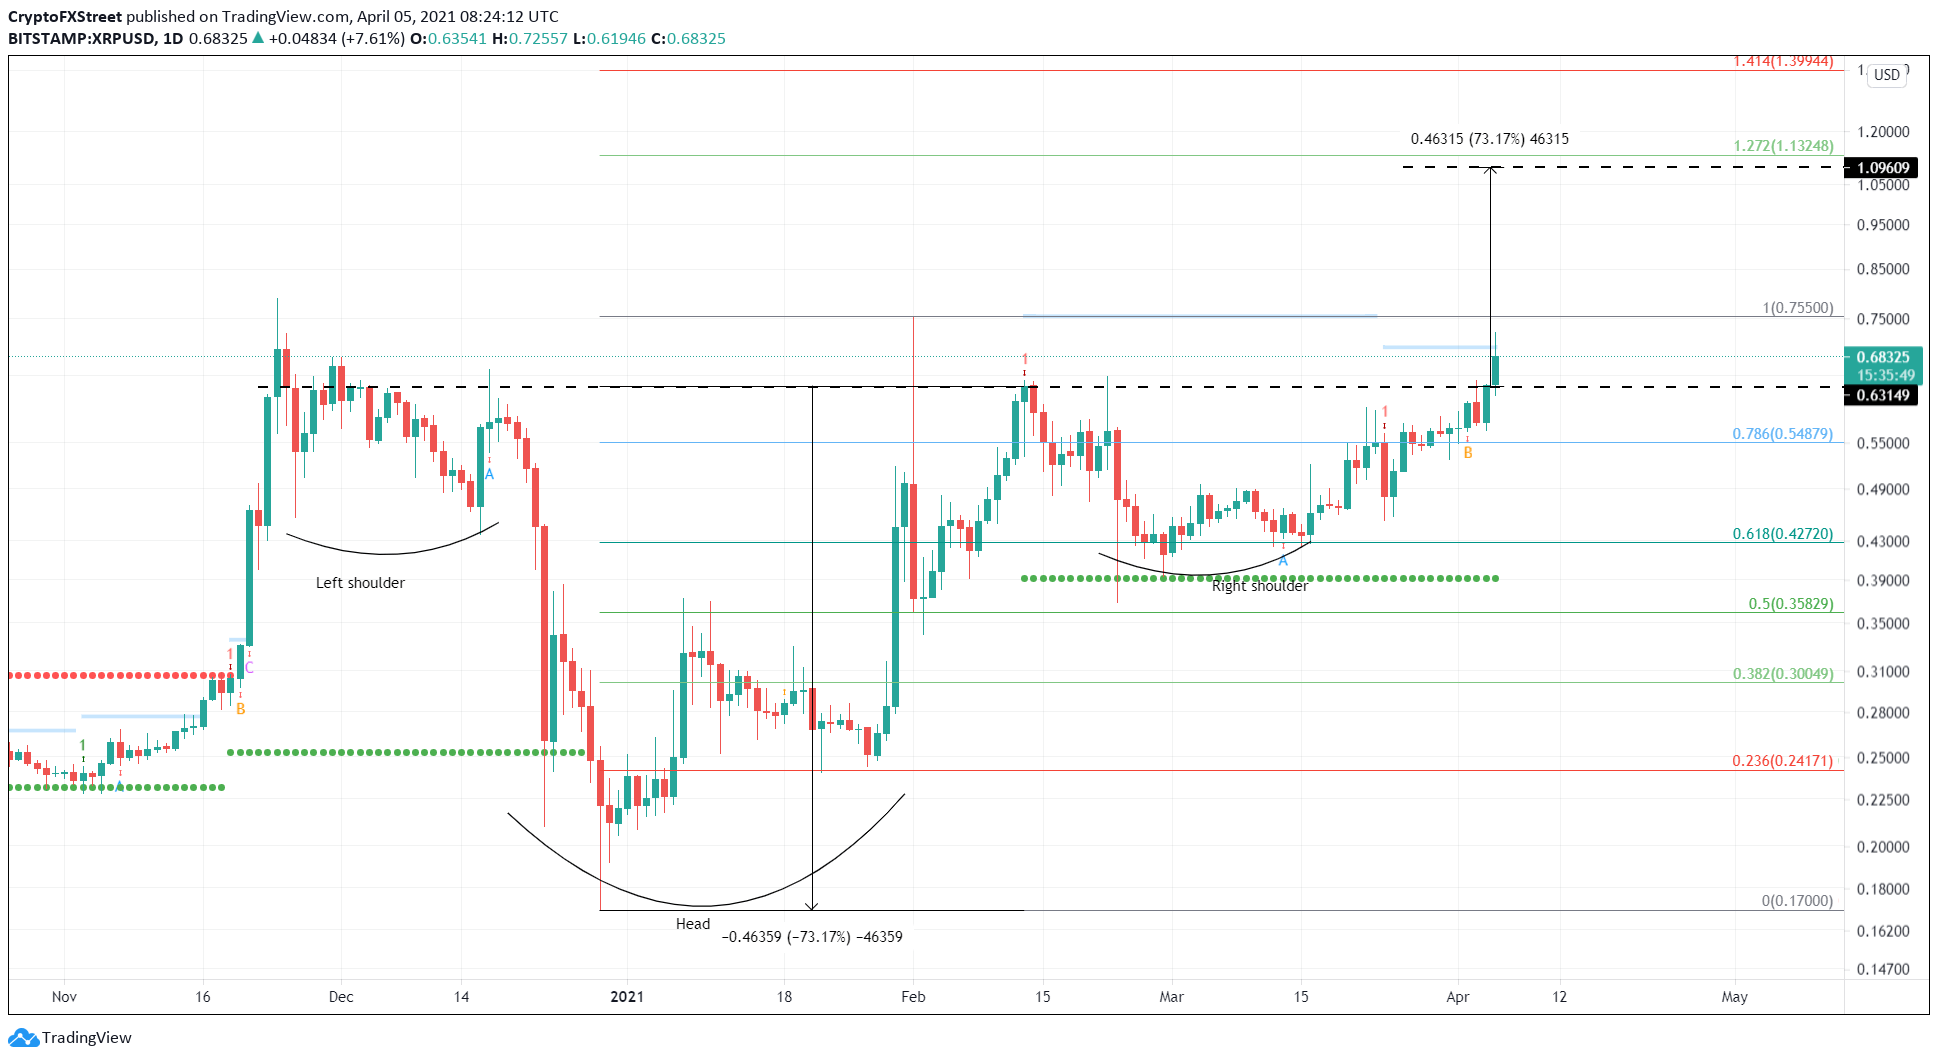
XRP/USDT 1-day chart
If the buyers fail to keep the XRP price above $0.63, then the upswing might be in danger. The bullish outlook will face extinction if the sellers push Ripple below 61.8% Fibonacci retracement level at $0.42.
Author

Akash Girimath
FXStreet
Akash Girimath is a Mechanical Engineer interested in the chaos of the financial markets. Trying to make sense of this convoluted yet fascinating space, he switched his engineering job to become a crypto reporter and analyst.


