Top 3 Price Prediction Bitcoin, Ethereum, Ripple: Decorrelation, Liquidity Hunts and Alternative Counts
- Bitcoin price has invalidated a widely held macroeconomic thesis.
- Ethereum price is not as severely damaged as other cryptocurrencies.
- XRP price could bounce towards $0.60 before another collapse.

Bitcoin, Ethereum and XRP price display evidence of decorrelation as all assets begin depicting a different narrative.
Bitcoin price needs an alternative wave count
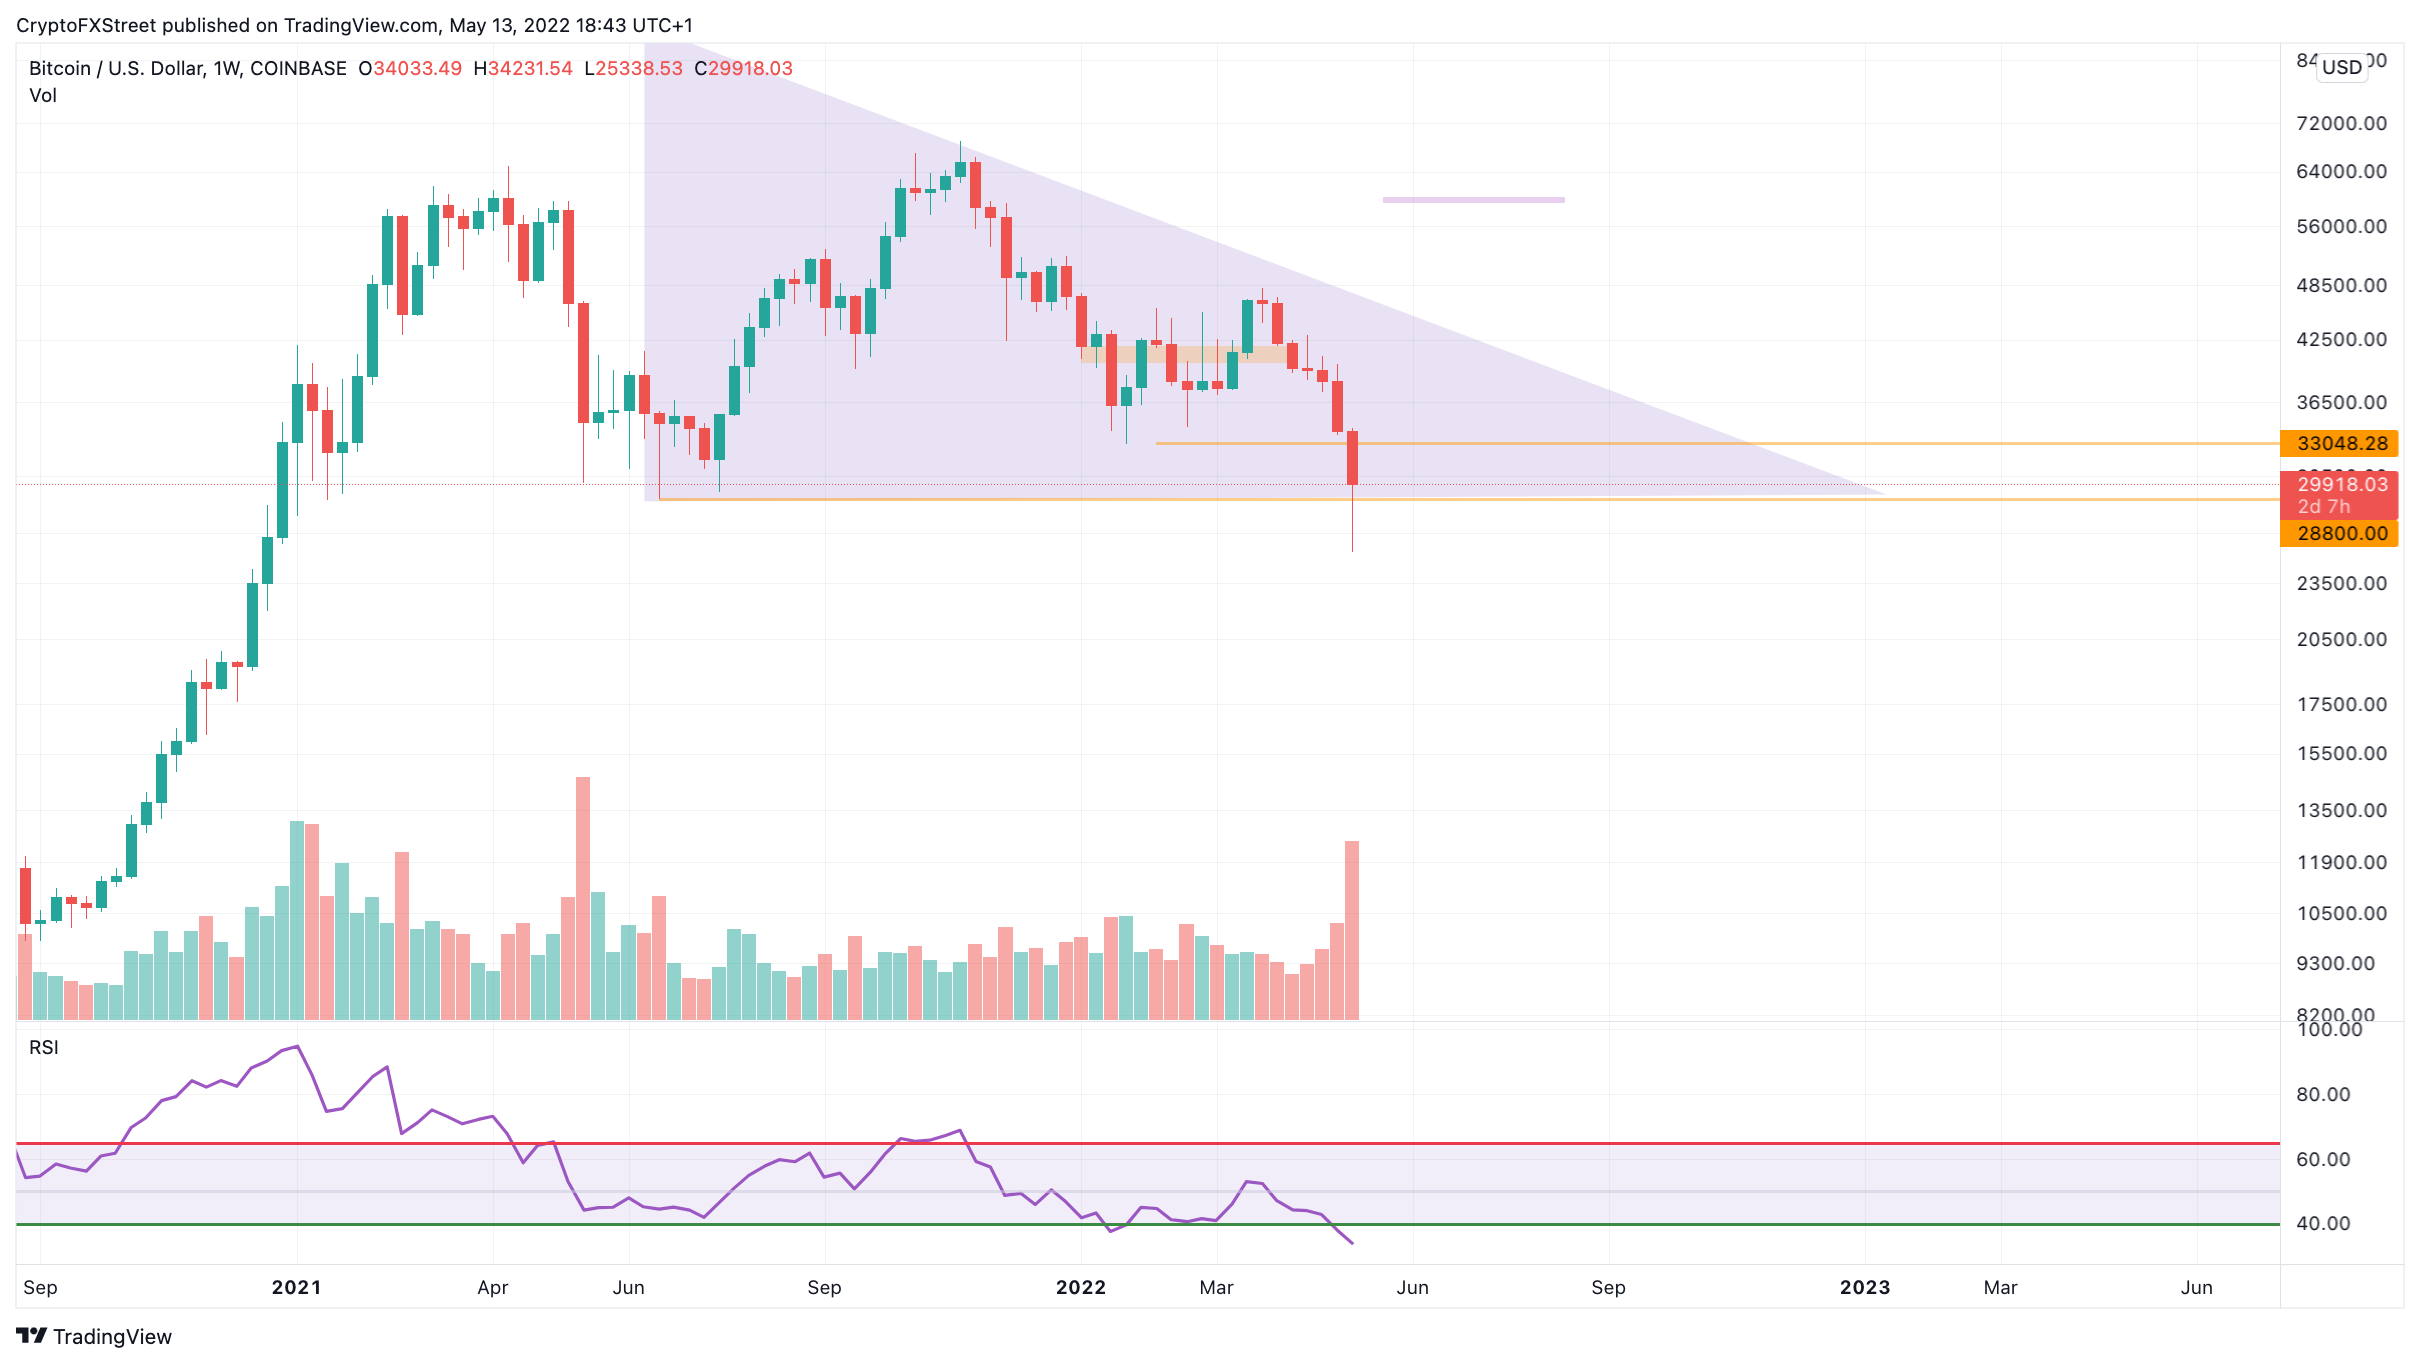
Bitcoin price has invalidated the widely held macro thesis amongst professional Elliot Wave traders. On Wednesday, May 11th, the bears managed to push the price below $28,800, forcing an end to the notorious Bitcoin Triangle thesis. Now that the initial macro thesis has been breached, an alternate count must be drawn up to forecast possible price action for the Bitcoin price.
Bitcoin price remains bullish on monthly and yearly charts. The volume indicator indicated the current sell-off as more of a corrective move with less volume relative to the 2020 and 2021 Bitcoin bull rallies. Thus, alternate counts for Bitcoin price could still forecast long-term targets well above $100,000 in the future. Still, readers are asked to please wait for an updated macro count as more evidence from the market will help depict a definitive narrative for the future Bitcoin price.
BTC/USD 1-Week Chart
Currently, the invalidation for the macro thesis lies at $14,000 but is subject to change once a new thesis is drawn up in the weeks to come. If the bears can breach $14,000, the entire uptrend scenario will be void with less than a 1% chance to see new all-time highs, while the bears could very well sweep pandemic lows at $6,000, resulting in an 80% dip from the current Bitcoin price.
Ethereum price is less damaged from a macro perspective
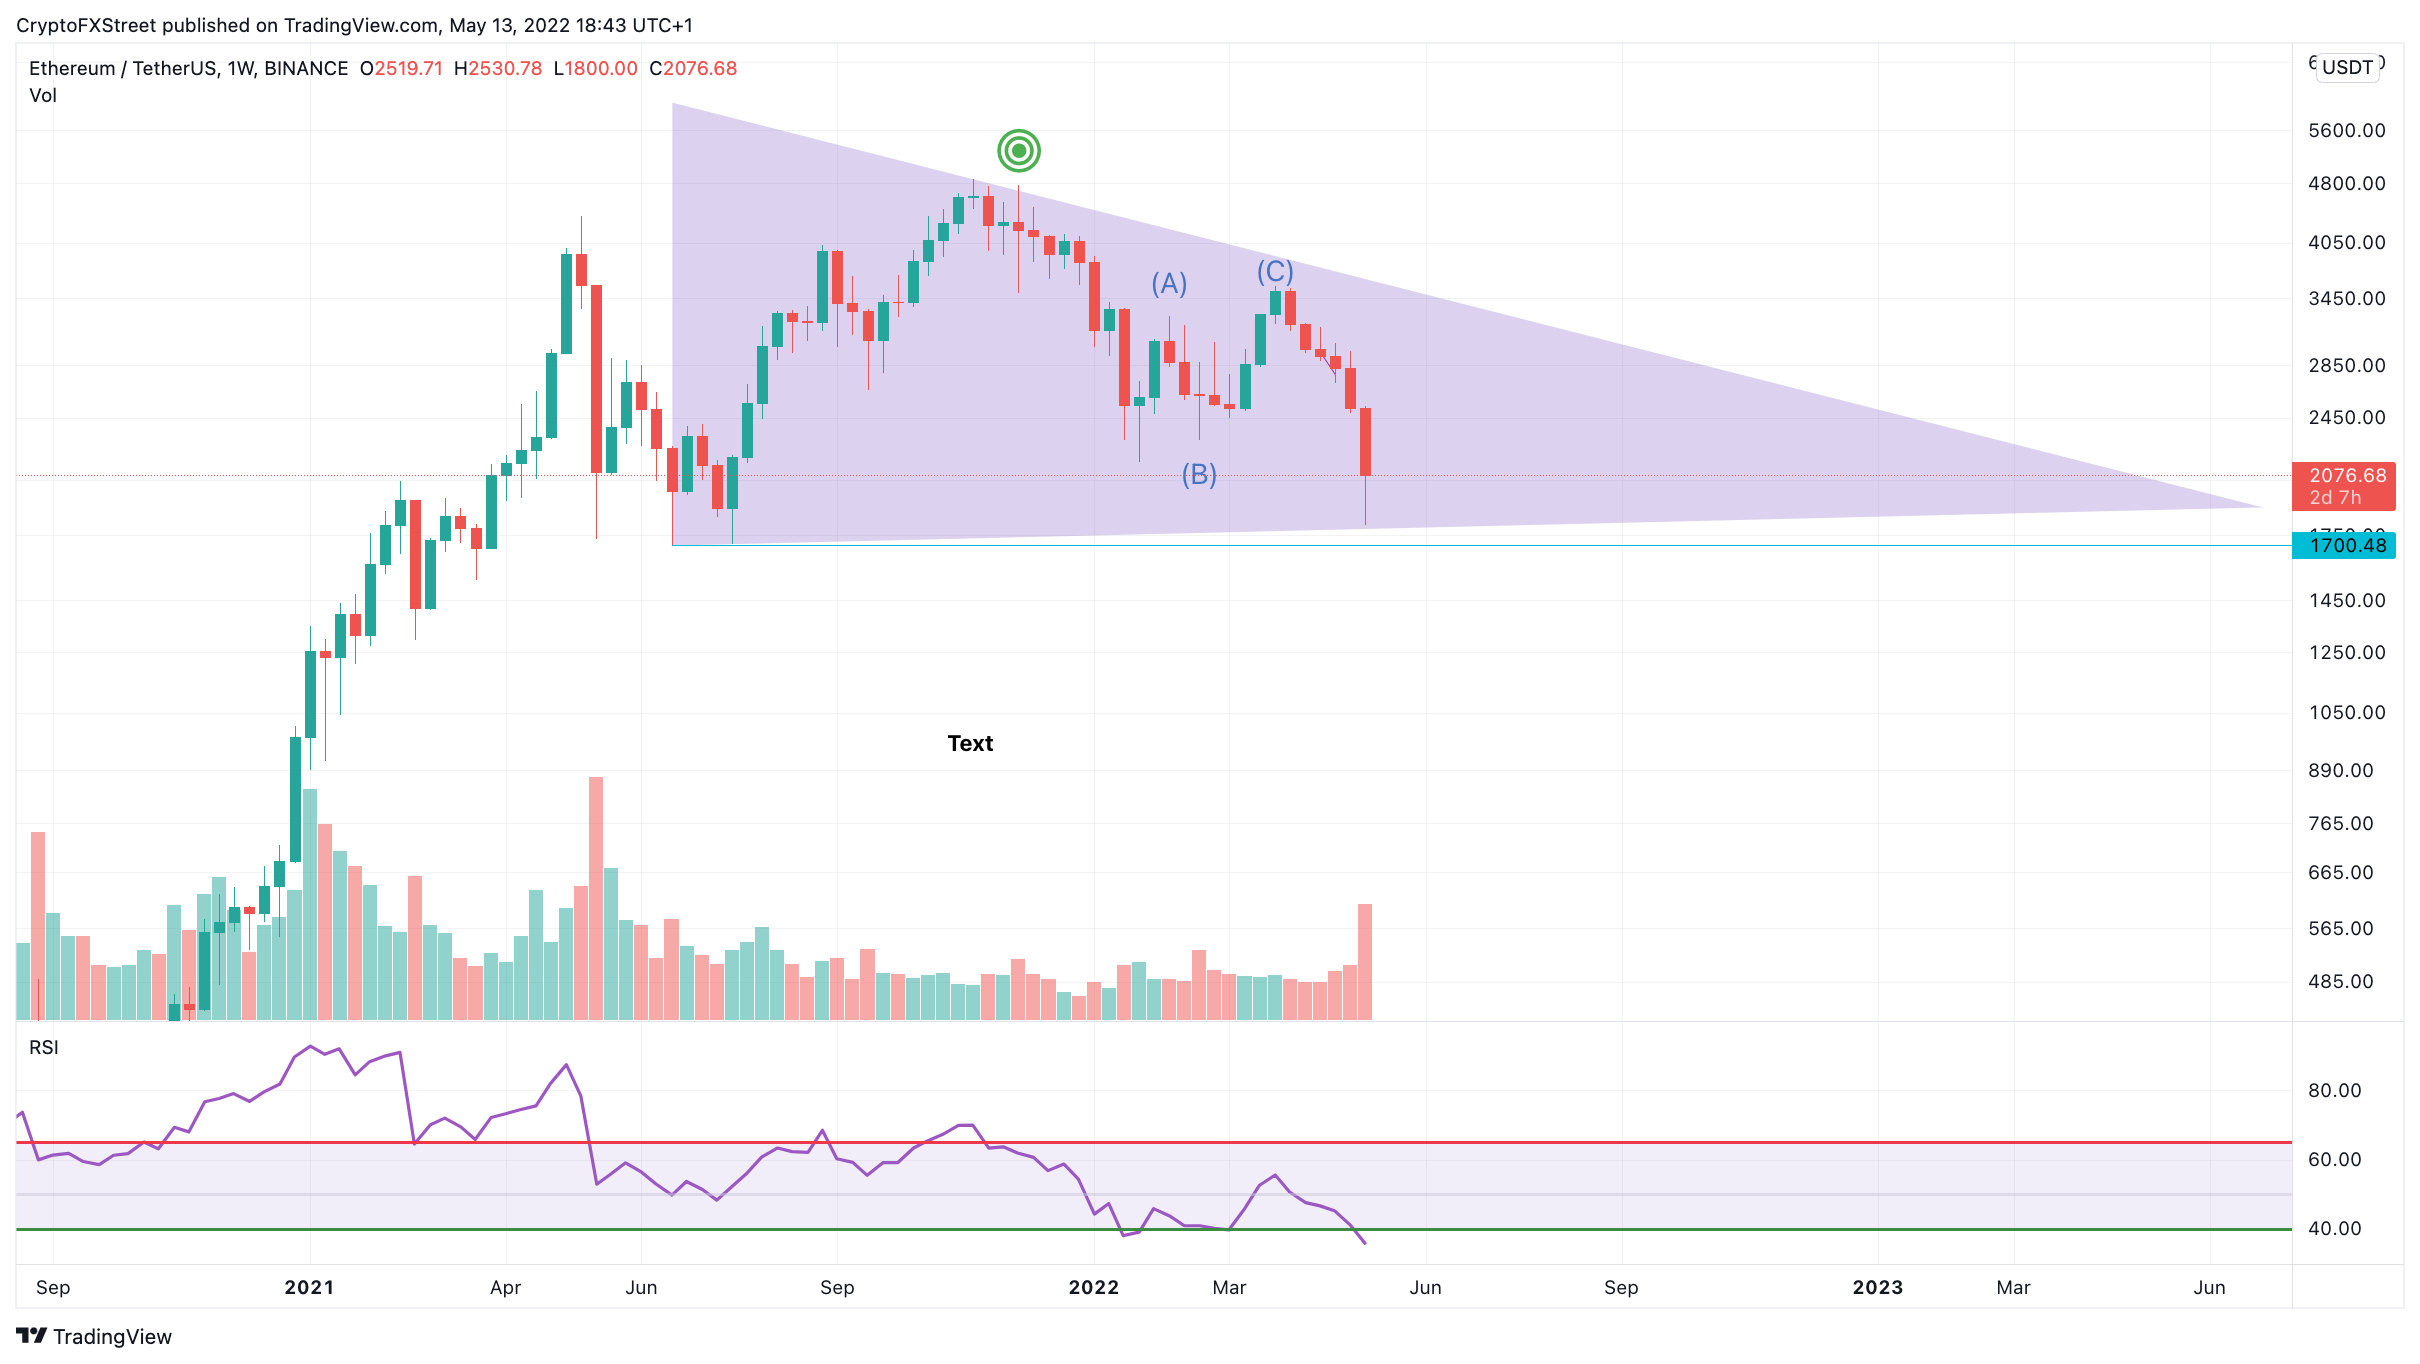
Ethereum price has undergone a harsh sell-off like most cryptocurrencies this week. The bears managed to accomplish a successful liquidity hunt as the yearly lows were breached at $2150. However, unlike Bitcoin and XRP, the Ethereum price has not breached 2021 lows at $1700.
Ethereum price has a big question mark surrounding the current price action and will likely need more evidence from the weekly chart to establish a confident outlook. If the bulls can hold the $1700 level and print a bullish hammer on the weekly chart, a macro range-bound triangle could be underway for the current ETH price.
ETH/USDT 1-Week Chart
The simplest invalidation level to use for scalping bullish countertrend rallies is now $1700. If bears break this level, the following bearish targets would be $1400 and $1100 in the coming weeks, resulting in a 45% dip from the current Ethereum price.
XRP price could trap early buyers before another dip
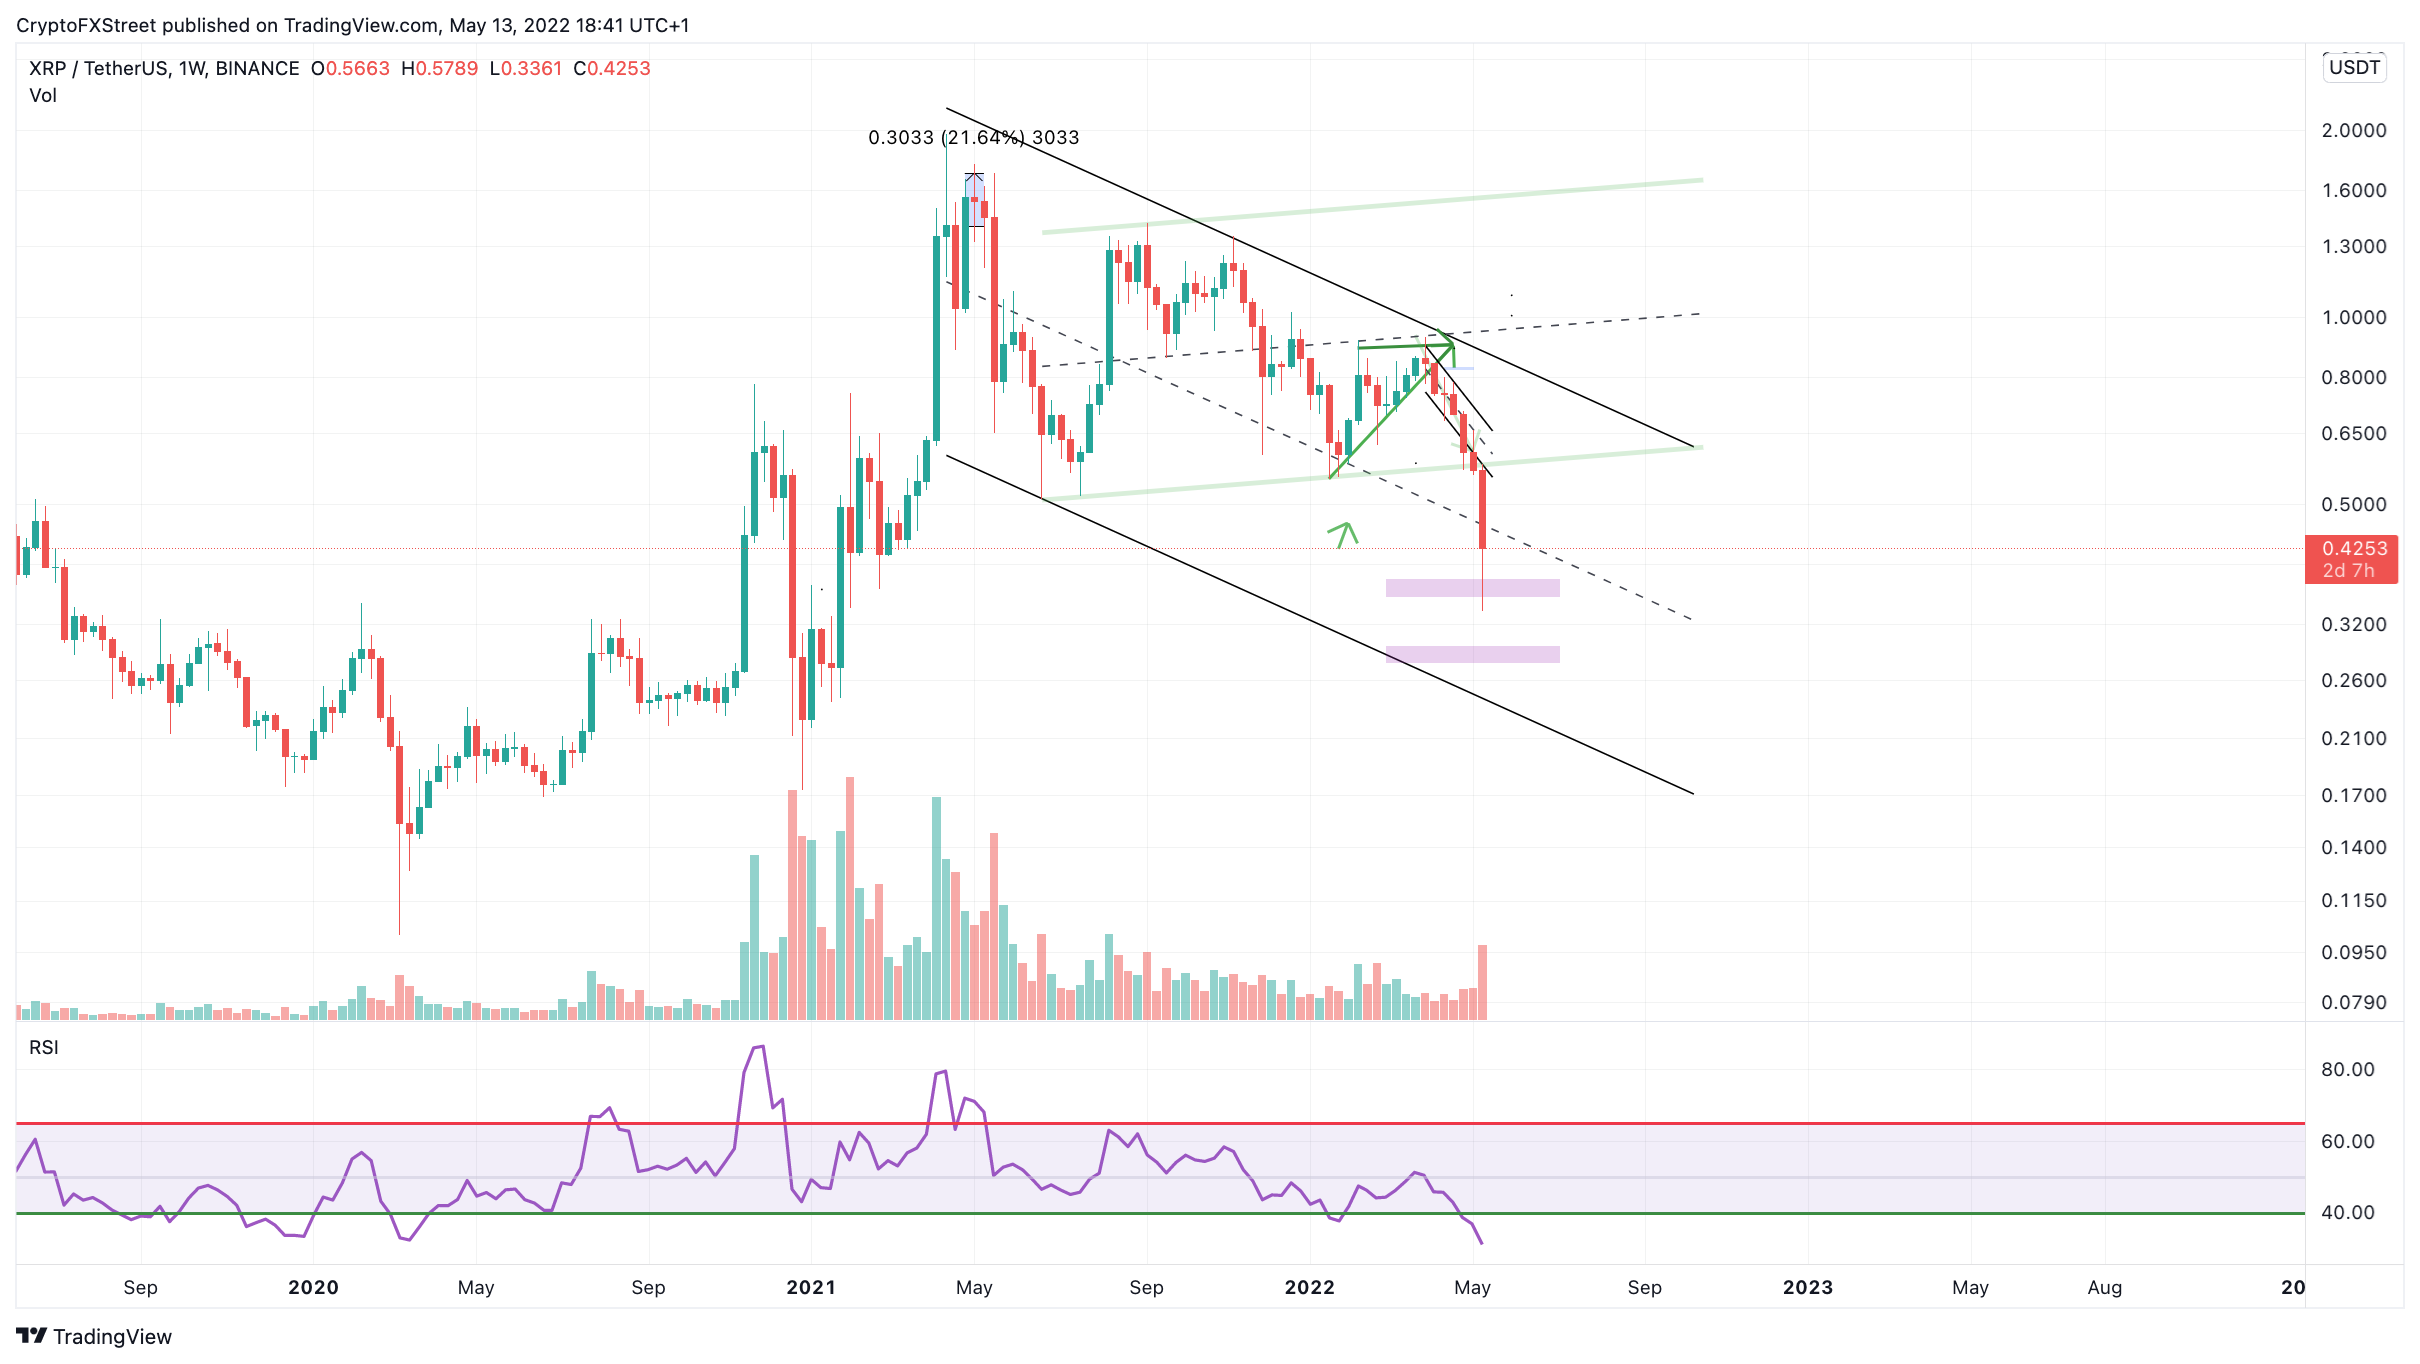
XRP price has breached a consolidation trend channel. A retest of the trend channel could set up a classic breach and retest strategy for bears looking to join the market. At the time of writing, the Ripple price trades at $0.42, a price hike of 40% to $0.57 could occur before the bears flex their bearish strength again.
XRP price has breached the first bearish target at $0.36, mentioned earlier this month. The following targets could be $0.34 and $0.27. It is worth noting that the volume profile indicates a bearish reconquering of the trend on the weekly chart. Long-term investors should consider rebalancing their portfolios to take advantage of future discounted prices.
XRP/USDT 1-Week Chart
Invalidation of the bearish downtrend is a break at $0.5978. If the bulls take this level, the entire downtrend could be terminated. The bulls could then reroute towards $1.00, resulting in a 140% increase from the current XRP price.
Author

Tony M.
FXStreet Contributor
Tony Montpeirous began investing in cryptocurrencies in 2017. His trading style incorporates Elliot Wave, Auction Market Theory, Fibonacci and price action as the cornerstone of his technical analysis.



