Top 3 Price Prediction Bitcoin, Ethereum, Ripple: Crypto bull cycle awaits Bitcoin's imminent upswing beyond $62,000
- Bitcoin faces stubborn resistance between $59,000 and $60,000, but the uptrend remains strong based on technical.
- Ethereum could freefall back to $1,700, support highlighted by the 100 SMA and 200 SMA.
- Ripple is poised for a 34% upswing following the maturity of a symmetrical triangle pattern.

The cryptocurrency bullish cycle is still intact, although it has reduced the aggressiveness. Bitcoin hit a wall marginally under $62,000 over the weekend, but a reversal occurred toward $53,000. The rebound that came into the picture failed to overcome the hurdle at $60,000, which explains the ongoing minor retreat.
Ethereum also tested support at $1,700 but is currently struggling with sustaining price action above $1,800. The cross-border token, Ripple, is dancing at $0.47 while focusing on making a real break above $0.5
Cardano is the most improved cryptoasset, with gains above 15%. The upcoming smart contract token has become the darling of the cryptocurrency space after listing on Coinbase Pro earlier in the week.
Bitcoin poised for another upswing to new record highs
The pioneer cryptocurrency is trading slightly under $58,000 following a retreat from highs above $59,000. Recovery from the recent dip to $53,000 lost steam before tackling the seller congestion at $60,000. However, support is envisioned at the 50 Simple Moving Average (SMA) on the 4-hour chart, whereby more buyers are expected to join the market.
Bitcoin only needs to slightly push upward to lift off to a new all-time high based on the strong technical levels. For instance, the Moving Average Convergence Divergence (MACD) has a bullish bias and is holding within the positive territory.
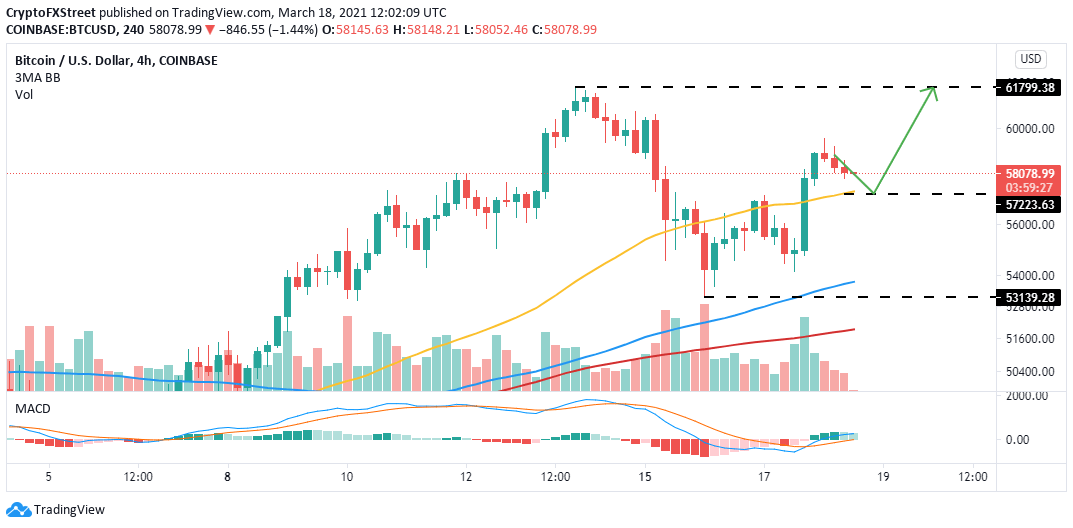
BTC/USD 4-hour chart
Ethereum on the verge of breakdown
Ether had sliced through the resistance at $1,800, but seller congestion at $1,850 cut short the breakout. A retreat followed with the price tumbling under the 50 SMA on the 4-hour chart. Sell orders appear to have been triggered following the slide below $1,800.
Meanwhile, Ethereum is trading at $1,790 as bulls fight to secure support at the ascending channel's lower edge. If this support is lost, Ether will be bound to fall to $1,700, where support has been provided by the 100 SMA and the 200 SMA.
Note that closing the day above the $1,800 and the 50 SMA would open the road for gains toward $2,000.
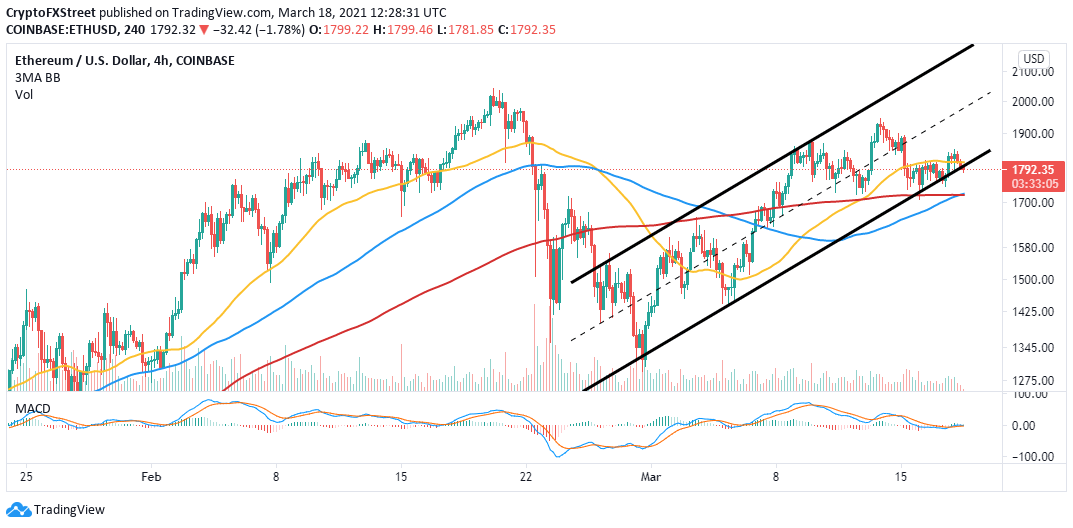
ETH/USD 4-hour chart
Ripple liftoff eyes highs above $0.6
XRP is trading above a symmetrical triangle pattern. This is the second time the cross-border token has broken out of this pattern. If the 200 SMA resistance (marginally under $0.5) cracks, XRP would complete the 34% upswing target to highs around $0.63.
The MACD indicator has been on an upward roll since the minor dip at the beginning of the week. The action beyond the mean line will signal that the trend is mainly in the bulls' hands. Moreover, closing the day above $0.5 will confirm to the bulls that Ripple is primed for gains to higher price levels.
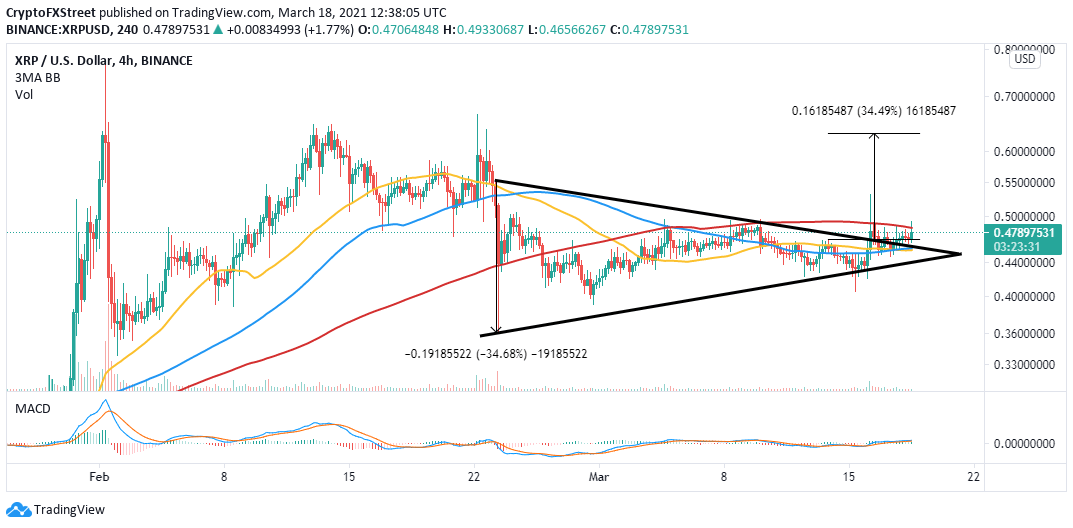
XRP/USD 4-hour hour chart
It is worth mentioning that the upswing will fail to occur if overhead pressure mounts under the 200 SMA. The downside support at the 50 SMA and 100 SMA must hold to cushion XRP from the drop. However, losses will increase appreciably of the price breaks under the robust support at $0.4.
Author

John Isige
FXStreet
John Isige is a seasoned cryptocurrency journalist and markets analyst committed to delivering high-quality, actionable insights tailored to traders, investors, and crypto enthusiasts. He enjoys deep dives into emerging Web3 tren


