Top 3 Price Prediction Bitcoin, Ethereum, Ripple: BTC hints at following ETH’s explosive rally, XRP indecisive
- Bitcoin price has been trading near the swing low formed after the crash but shows signs of resuscitation shortly.
- Ethereum price is less than 4% away from retesting its all-time high at $2,548.
- XRP price shows a lack of bullish momentum as it hovers around a crucial area of interest.

Bitcoin price seems to be coiling up for an upswing as it trades around a crucial support level. Ethereum, on the other hand, has already seen a massive run-up that might retest its local top. Unlike BTC or ETH, XRP shows signs of a drop from a technical perspective.
Bitcoin price awaits volatility
After the recent crash, Bitcoin price set up swing points around $57,000 and $54,400. Since this point, the pioneer cryptocurrency has stuck to this range but is experiencing a minor deviation at the time of writing.
Interestingly, the price action that led to the formation of this spike below the swing low has set up a bullish divergence with the Relative Strength Index (RSI) on the 4-hour chart.
This technical formation is established when the short-term sellers push the price lower, creating lower lows, while the bullish momentum, as seen on the RSI, sets up higher highs. This divergence forecasts that an upswing will follow.
A decisive close above the 50% Fibonacci retracement level at $55,683 will provide secondary confirmation to this bull rally. In such a case, Bitcoin price will test $56,921, and if the buying pressure persists, $58,488.5.
Under special circumstances, $59,479 might also be tested.
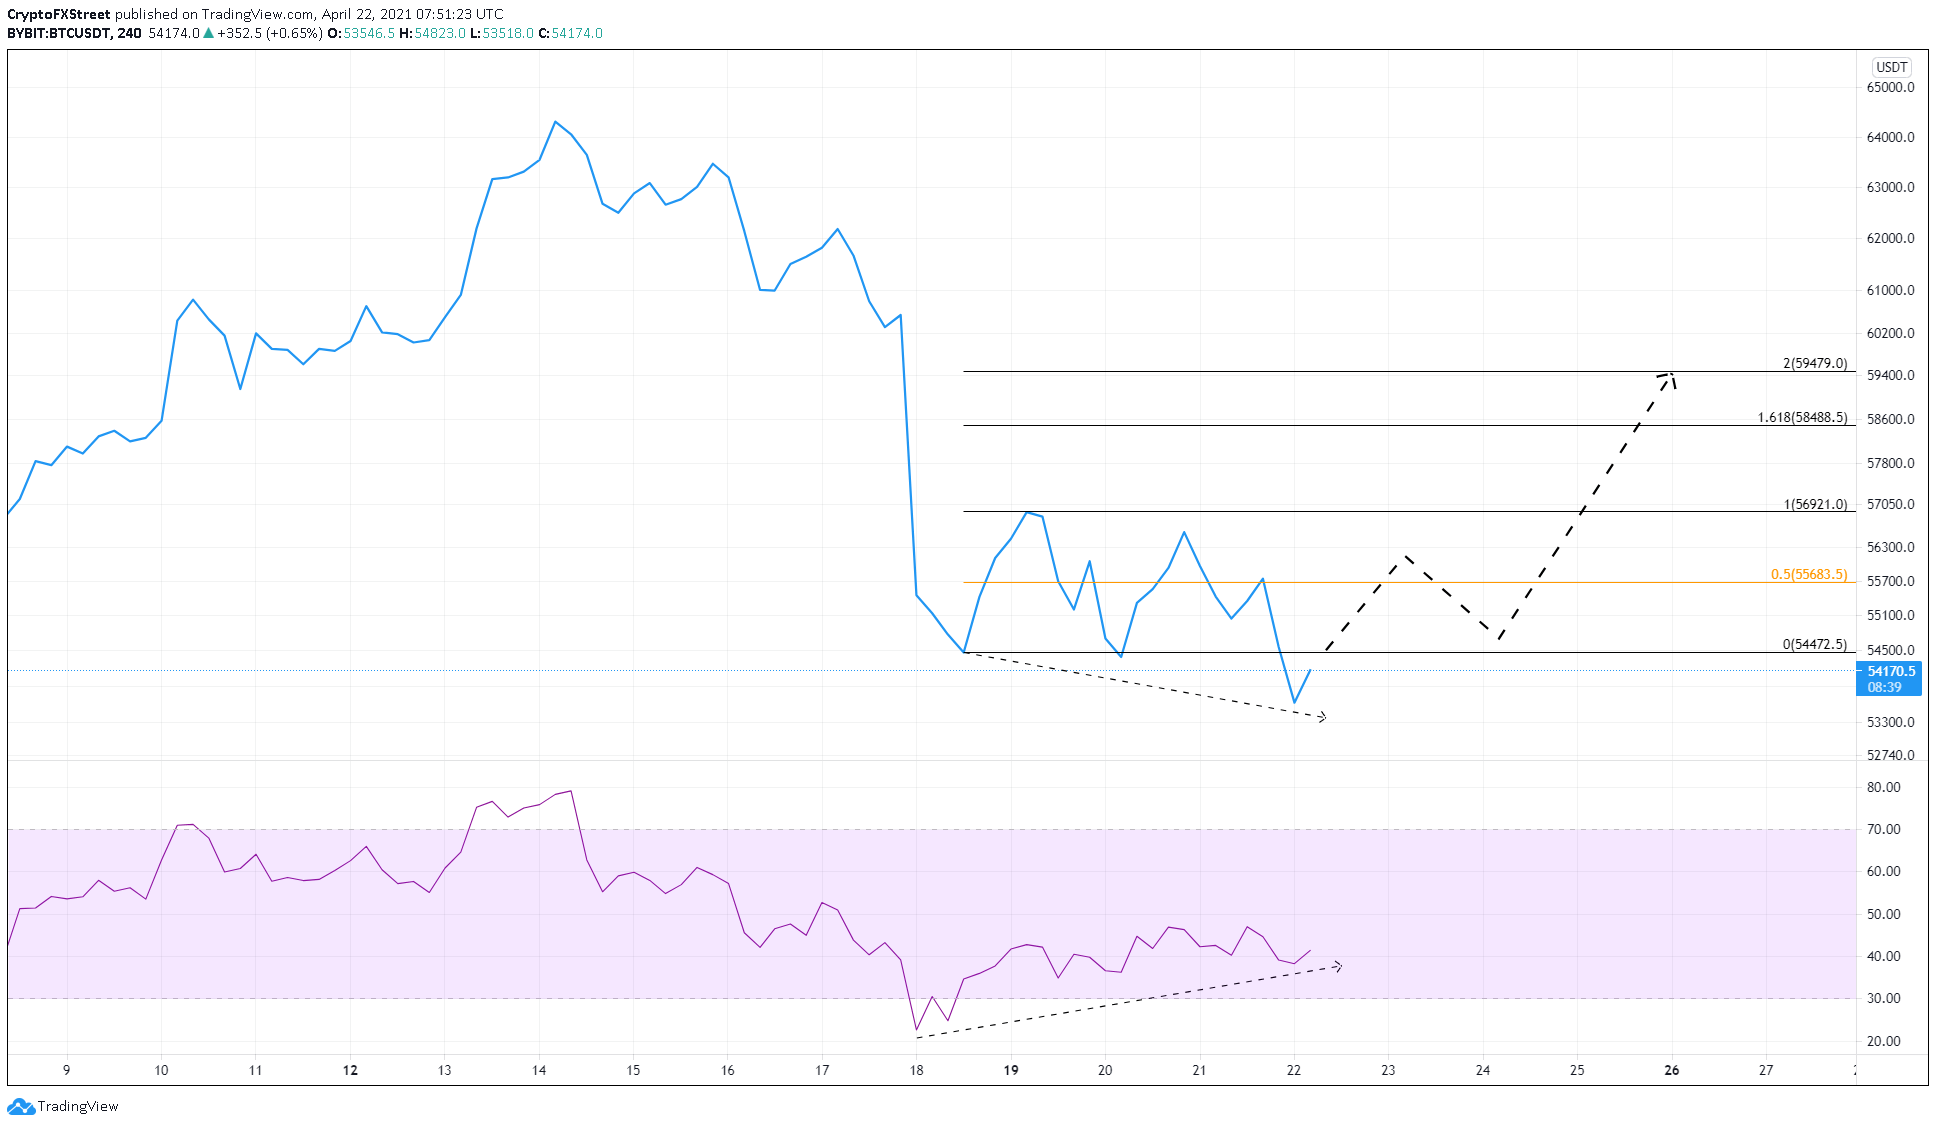
BTC/USDT 4-hour chart
If the buyers fail to keep Bitcoin price above $52,000, a 5% crash will cause the flagship crypto to revisit $50,500. A breakdown of this level might see BTC dip to $49,400.
Ethereum price closes in on all-time highs
Ethereum price has been on a tear since the weekend crash on April 18. The pioneer altcoin has recently sliced through a crucial area of interest that ranges from $2,310 to $2,384, flipping it into a demand zone.
Now, a retest of this level seems likely before ETH retests its all-time high of $2,548.
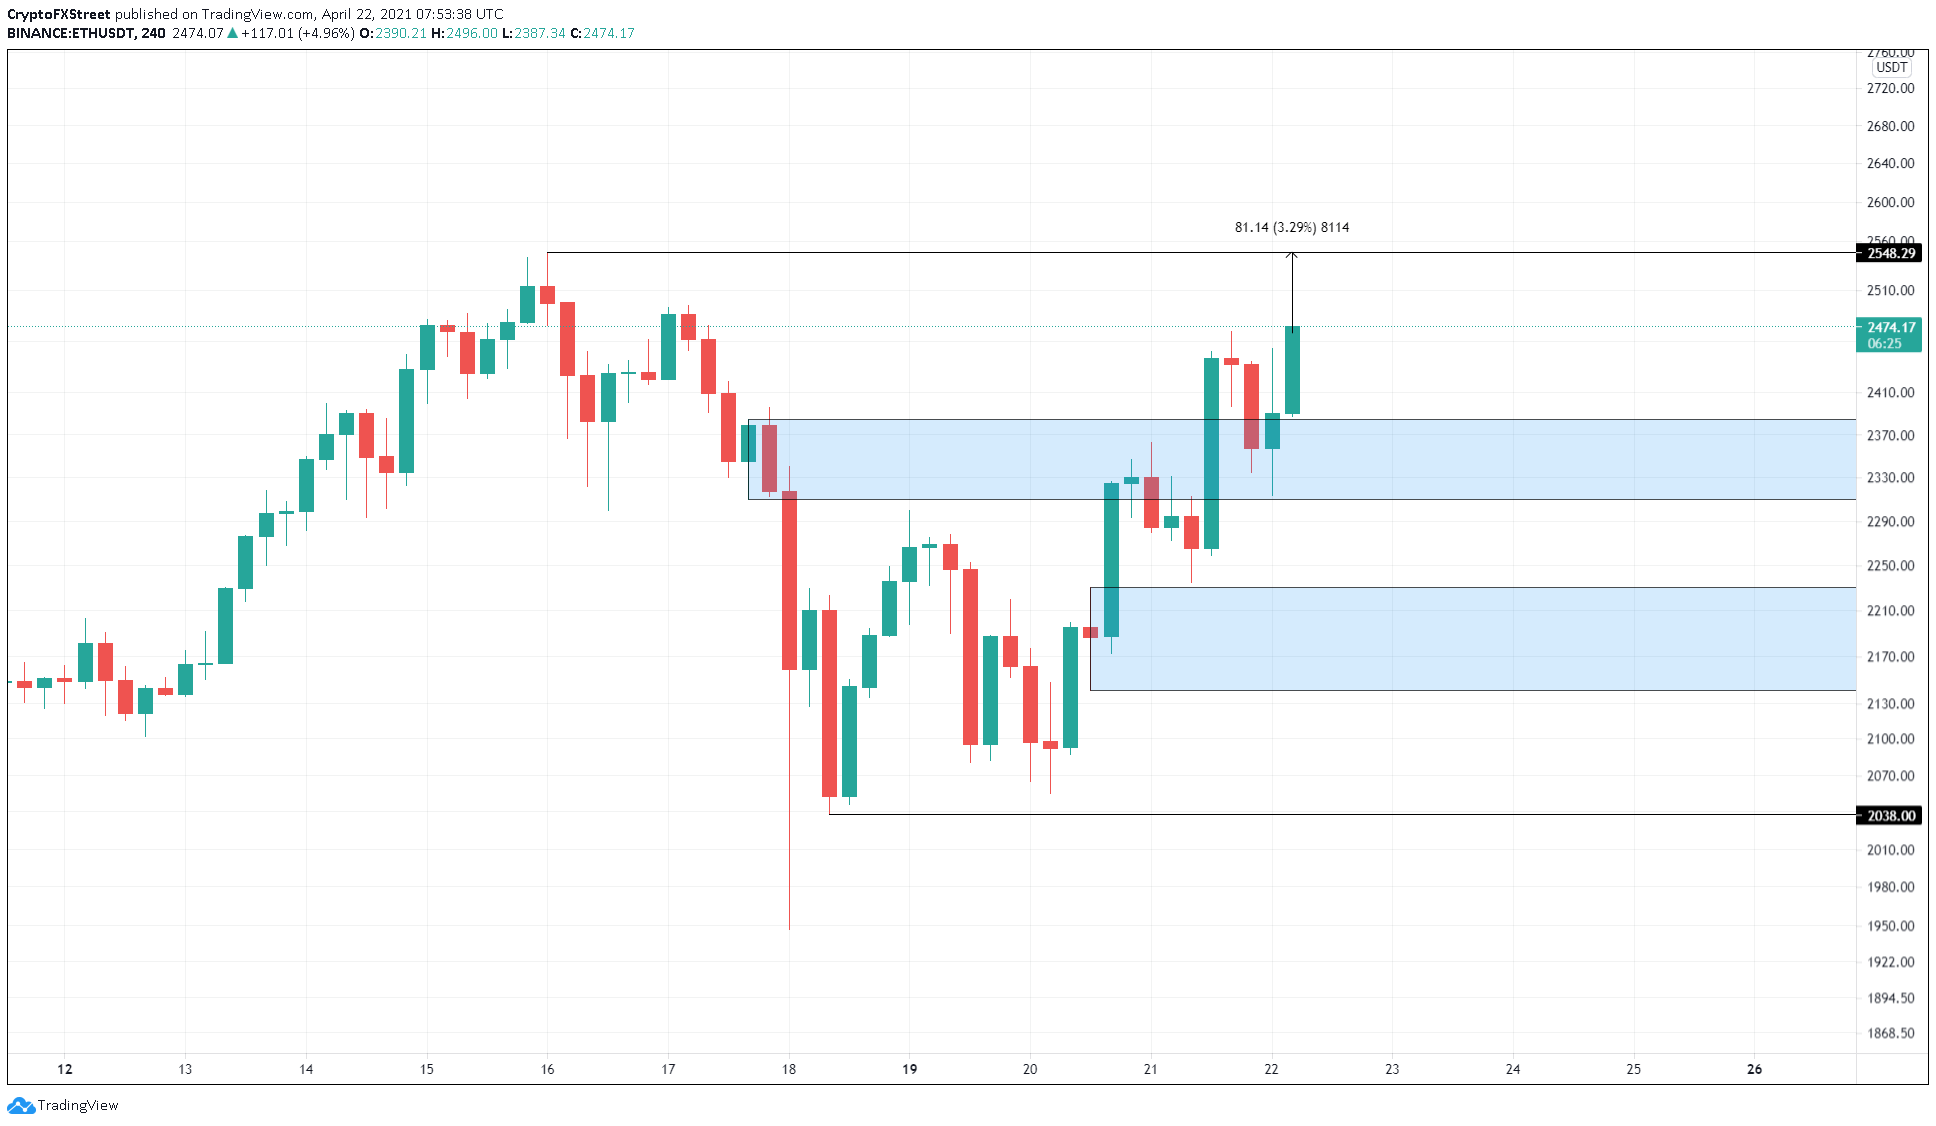
ETH/USDT 4-hour chart
If the sellers overwhelm the buyers, leading to a 4-hour candlestick close below $2,310, it would question the bullish thesis in play. However, if the smart contracts platform pierces the subsequent demand barrier’s upper layer at $2,230, it would invalidate the bullish case.
Under those circumstances, ETH could slide toward this zone’s lower end at $2,143.
XRP price signals incoming drop
XRP price has depreciated nearly 35% since hitting $1.96 on April 14. The lack of bullish momentum has caused it to slice through a 12-hour demand zone, converting it into an area of resistance.
Hence, the remittance token is likely to continue its descent.
Making matters worse is the recently established bearish pennant pattern on the 4-hour chart signaling a 35% drop to $0.80. While a crash of such an extent is unlikely to happen twice in such proximity, investors should consider a 20% drop to the demand zone that extends from $1.04 to $0.98.
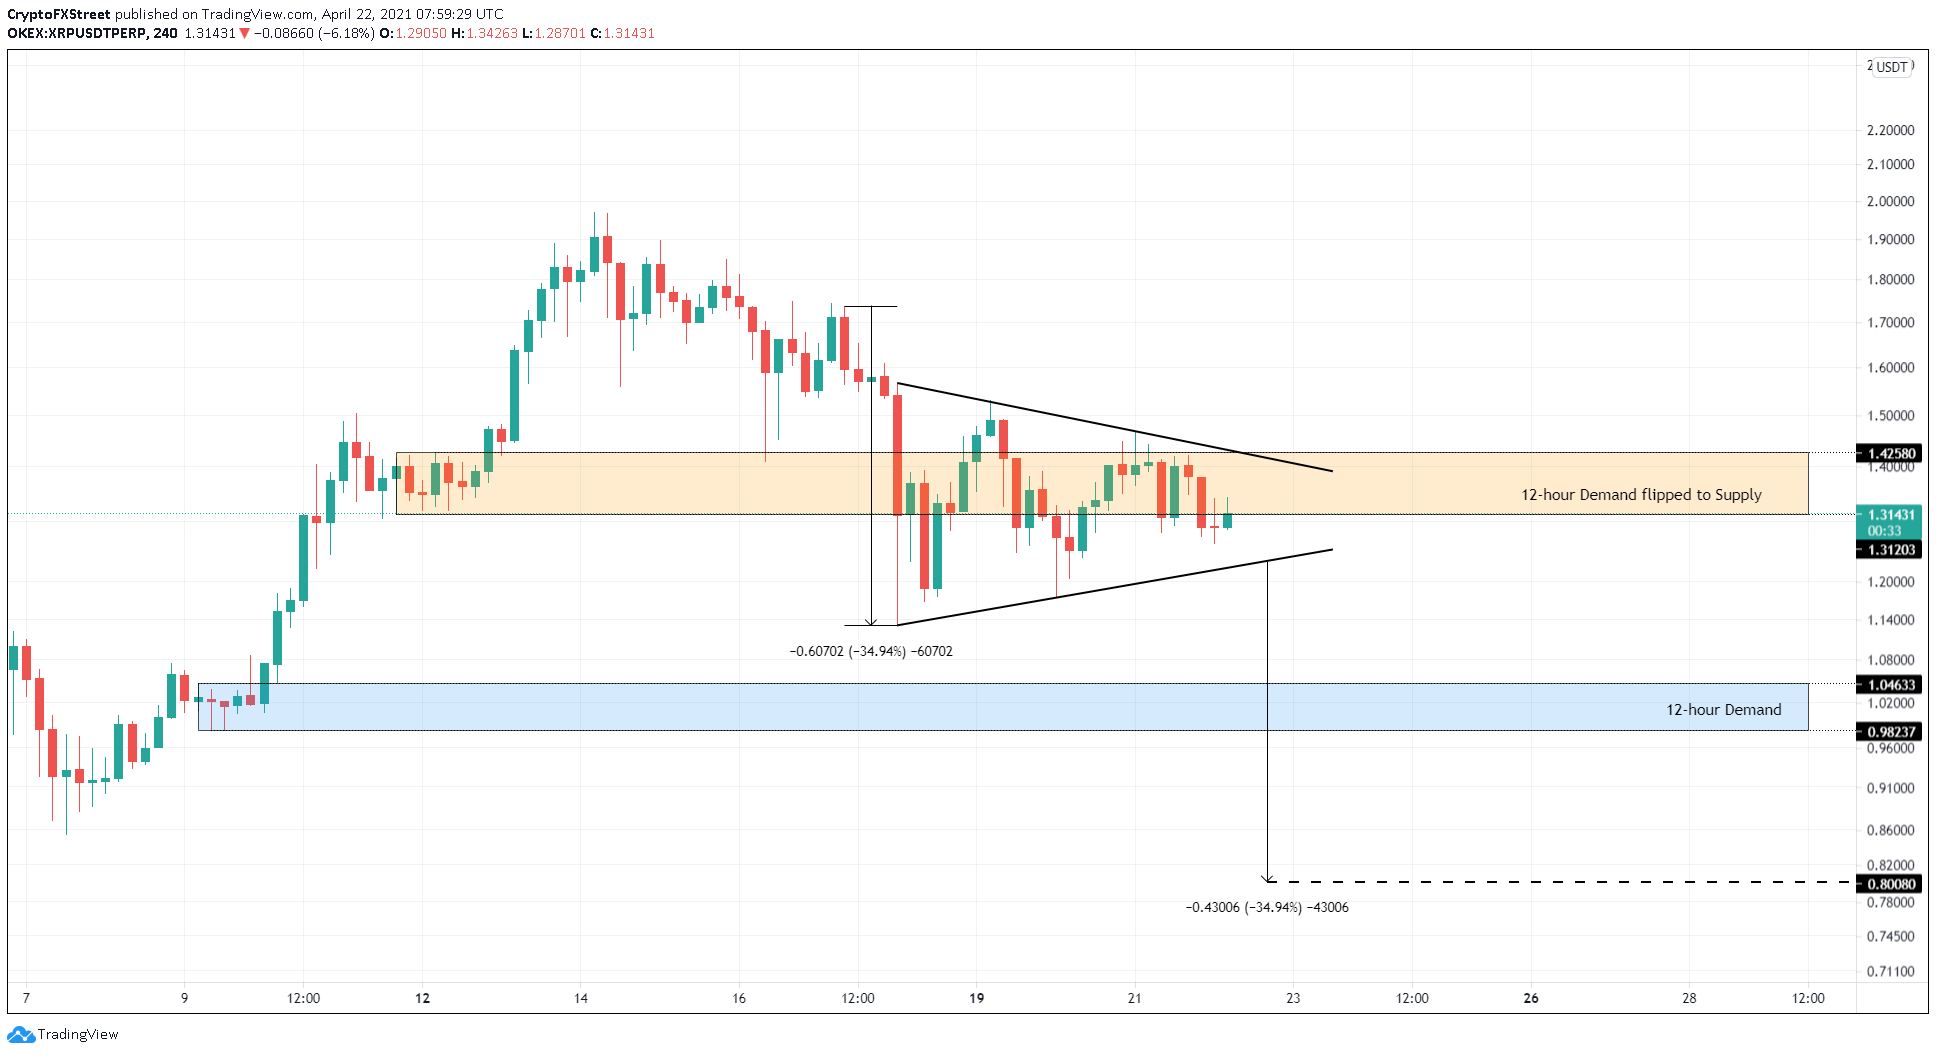
XRP/USDT 4-hour chart
While everything seems to be working against the ascent of XRP price in the short term, a potential spike in bid orders that pushes it above $1.42 will postpone the downswing. However, a solid 4-hour candlestick close above $1.53 will invalidate the bearish thesis and trigger an optimistic scenario for the remittance token that could appreciate its market value to revisit the yearly highs at $1.96.
Author

Akash Girimath
FXStreet
Akash Girimath is a Mechanical Engineer interested in the chaos of the financial markets. Trying to make sense of this convoluted yet fascinating space, he switched his engineering job to become a crypto reporter and analyst.




