XRP Price Prediction: Ripple needs to claim this demand barrier to prevent 18% crash
- XRP price has flipped a crucial demand zone into supply after the recent slump.
- An 18% drop to $1.04 could ensue if bulls fail to rescue Ripple here.
- On-chain metrics hint at a semi-stable state that could flip bearish anytime.

XRP price has been in a corrective phase for over a week and could retrace more before it begins to turn around.
XRP price on the verge of collapse
XRP price has recently sliced through a crucial area of demand that extends from $1.31 to $1.42. A failure to reclaim this level will result in bears running amok. Such a development could push the remittance token down by 18% to the subsequent demand zone’s upper boundary at $1.04.
Additionally, the 4-hour chart shows the formation of a bearish pennant, a breakdown of which could result in a steep correction. This technical formation contains an initial drop, which forms a flagpole, followed by consolidation between two converging trend lines known as the pennant.
The setup forecasts a 35% drop, determined by adding the flagpole’s height to the breakout point at $1.23. While such a crash is a little extreme in bull markets, investors should keep a close eye on the said demand barrier.
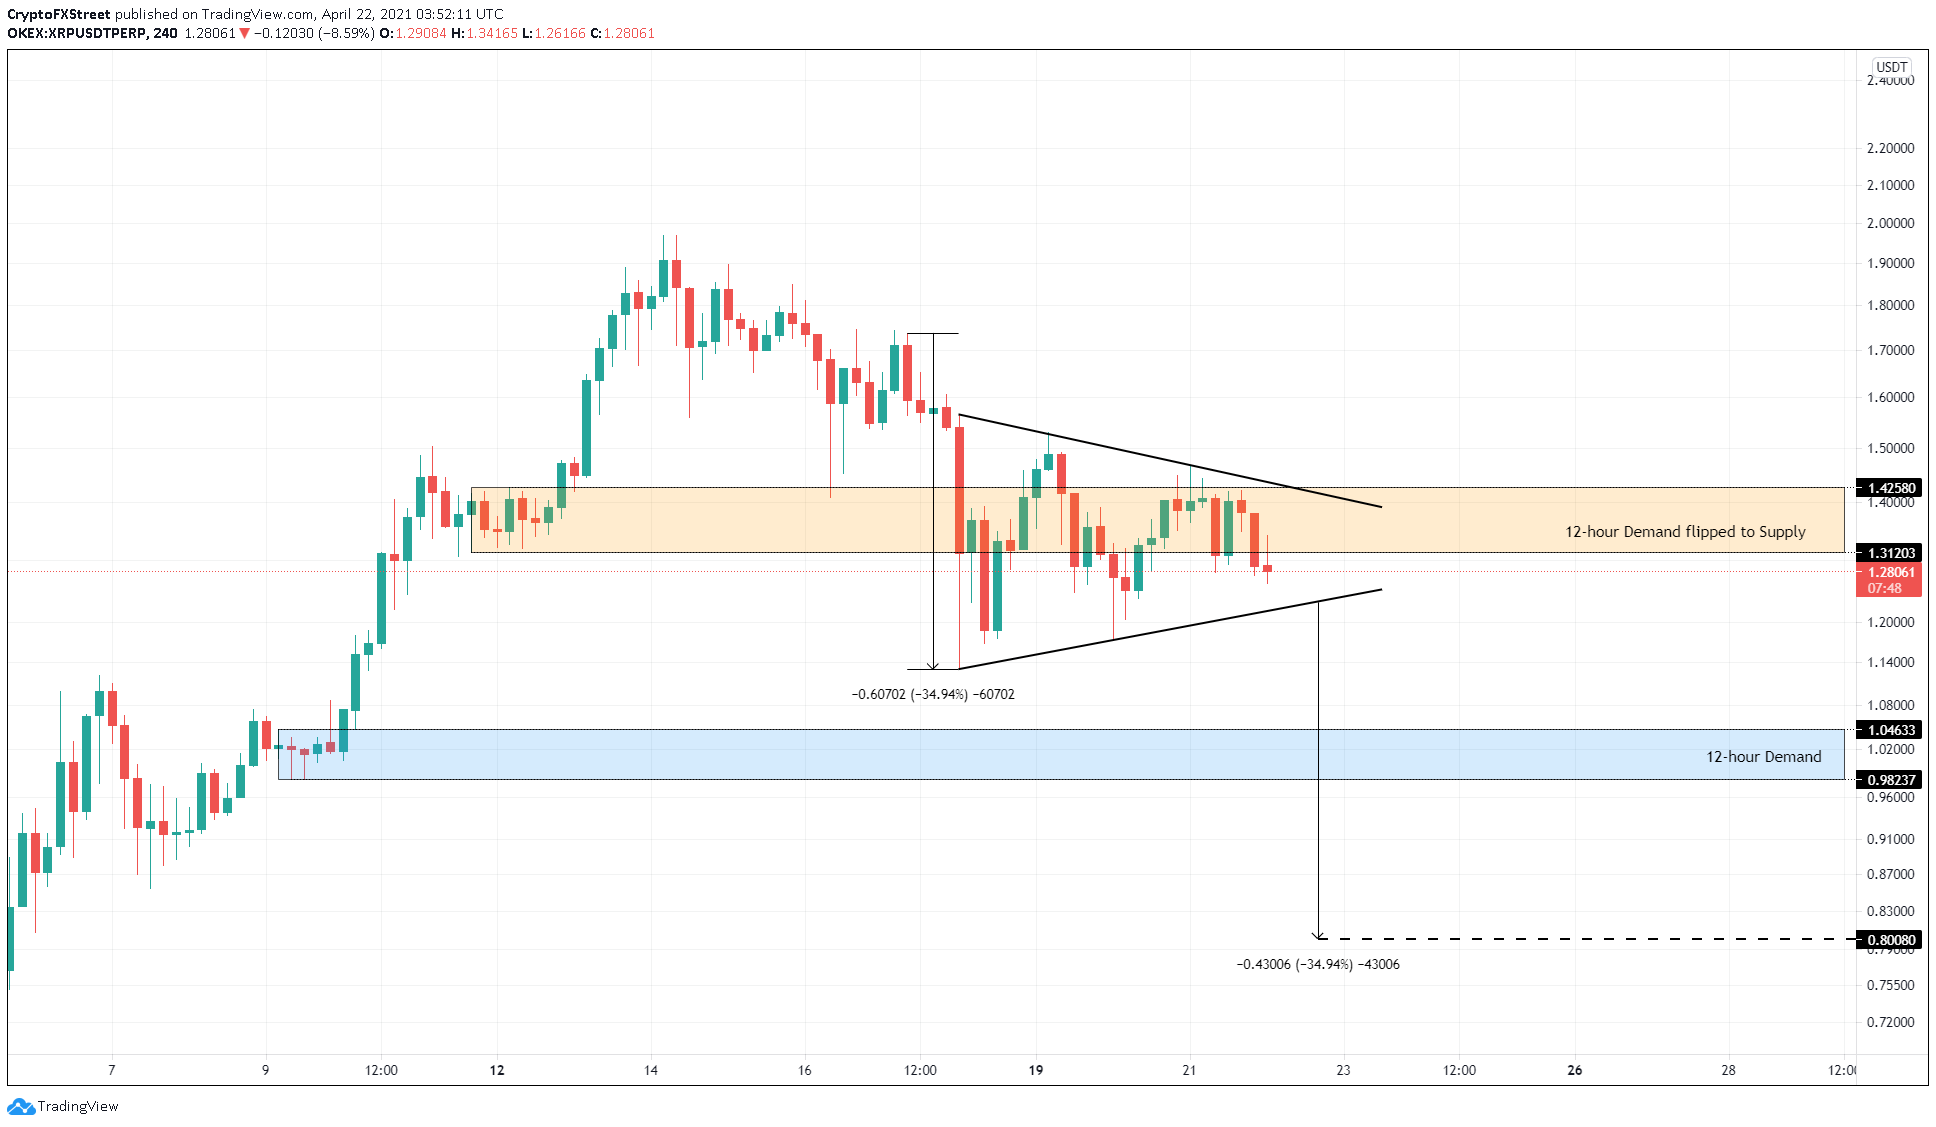
XRP/USDT 4-hour chart
While technicals seem to be bearish, on-chain metrics are displaying a semi-stable phase for XRP.
Santiment’s 30-day MVRV model for Ripple shows that users started booking profits since XRP price hit $1.8. Therefore, this metric has dropped nearly 75% to 30.2%, where it currently stands.
While the MVRV hasn’t reset, it is too early to estimate if it is time to start scooping up XRP.
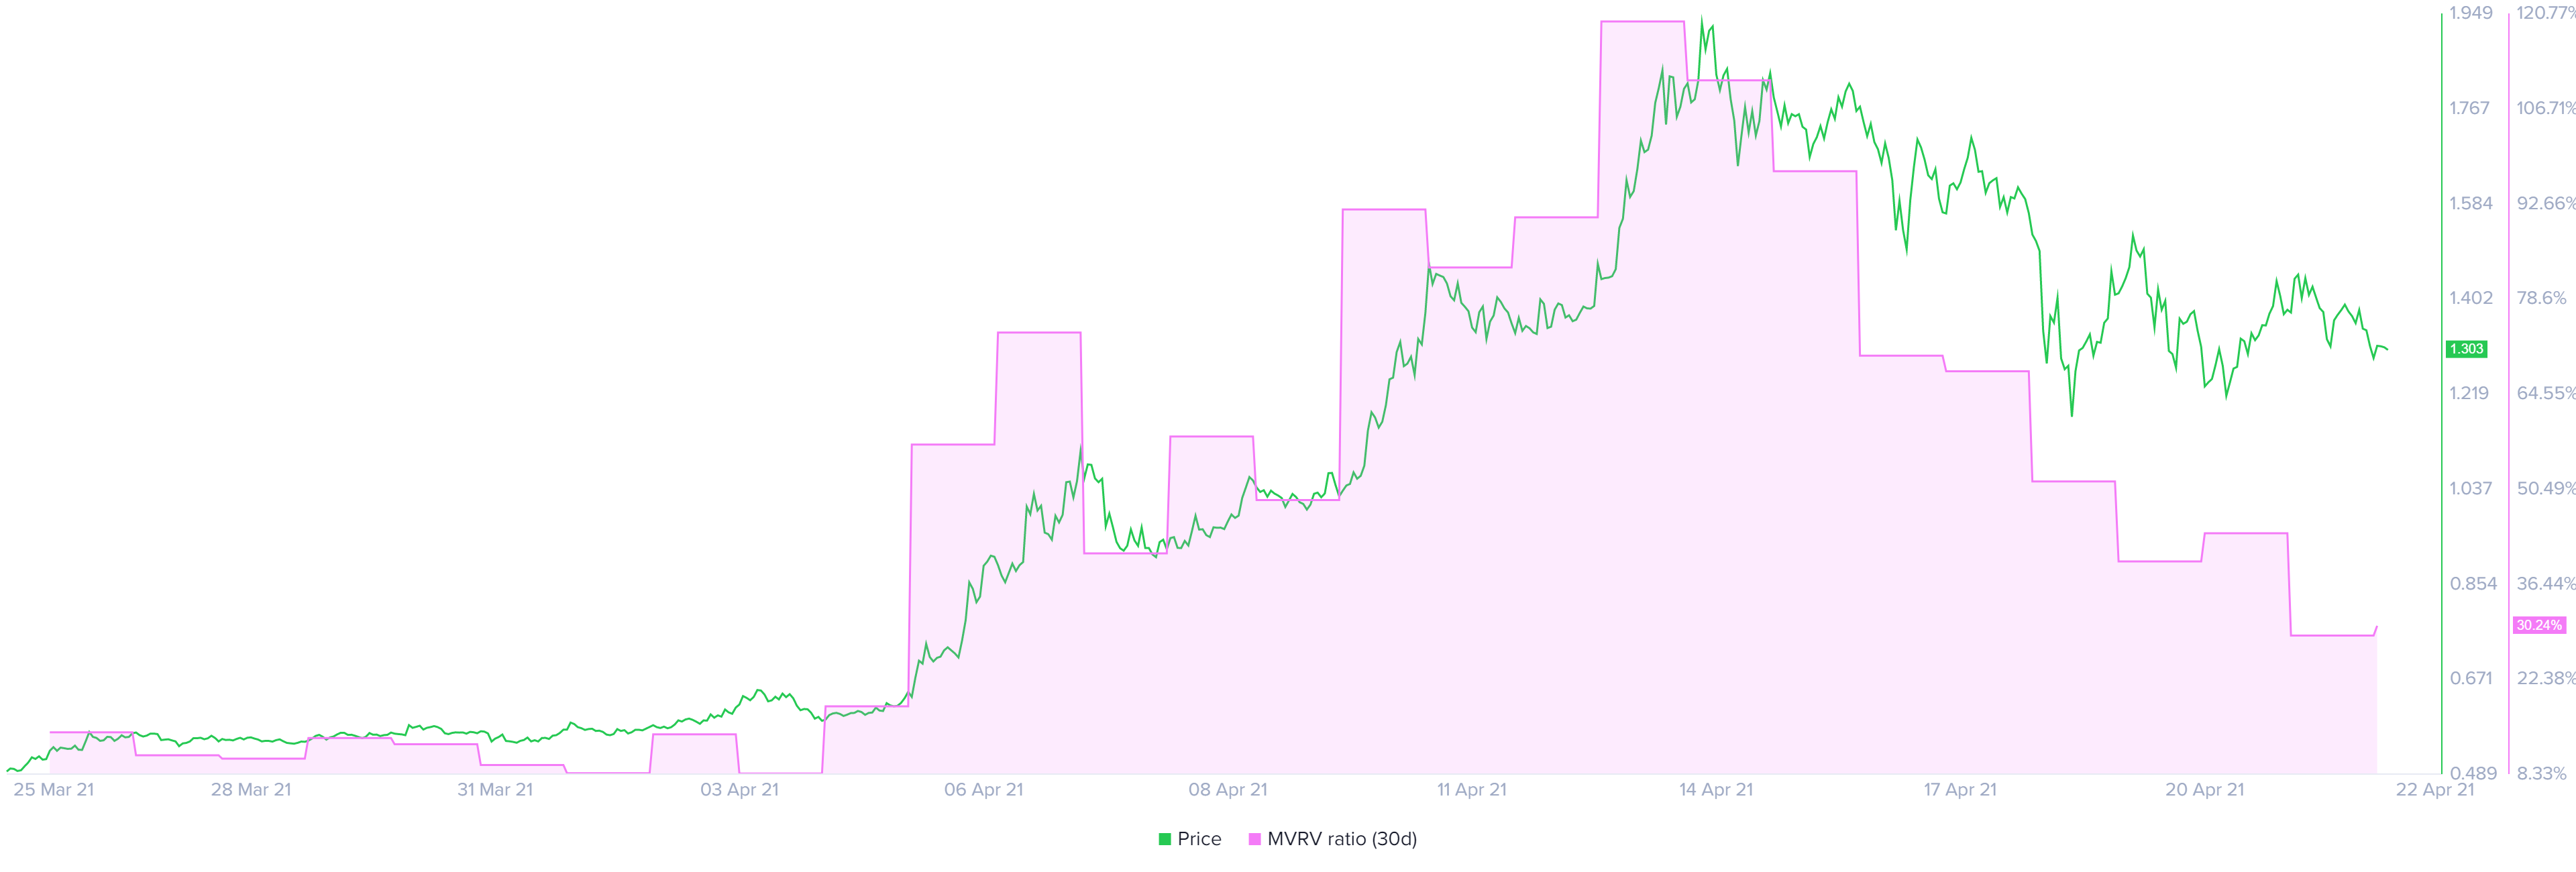
XRP 30-day MVRV chart
Unlike the above metric, Ripple’s supply distribution shows that whales are optimistic about XRP price. Since April 17, 19 new investors holding between 1,000,000 to 10,000,000 XRP have joined the XRP network, reinforcing the bullish narrative from high-net-worth individuals’ perspective.
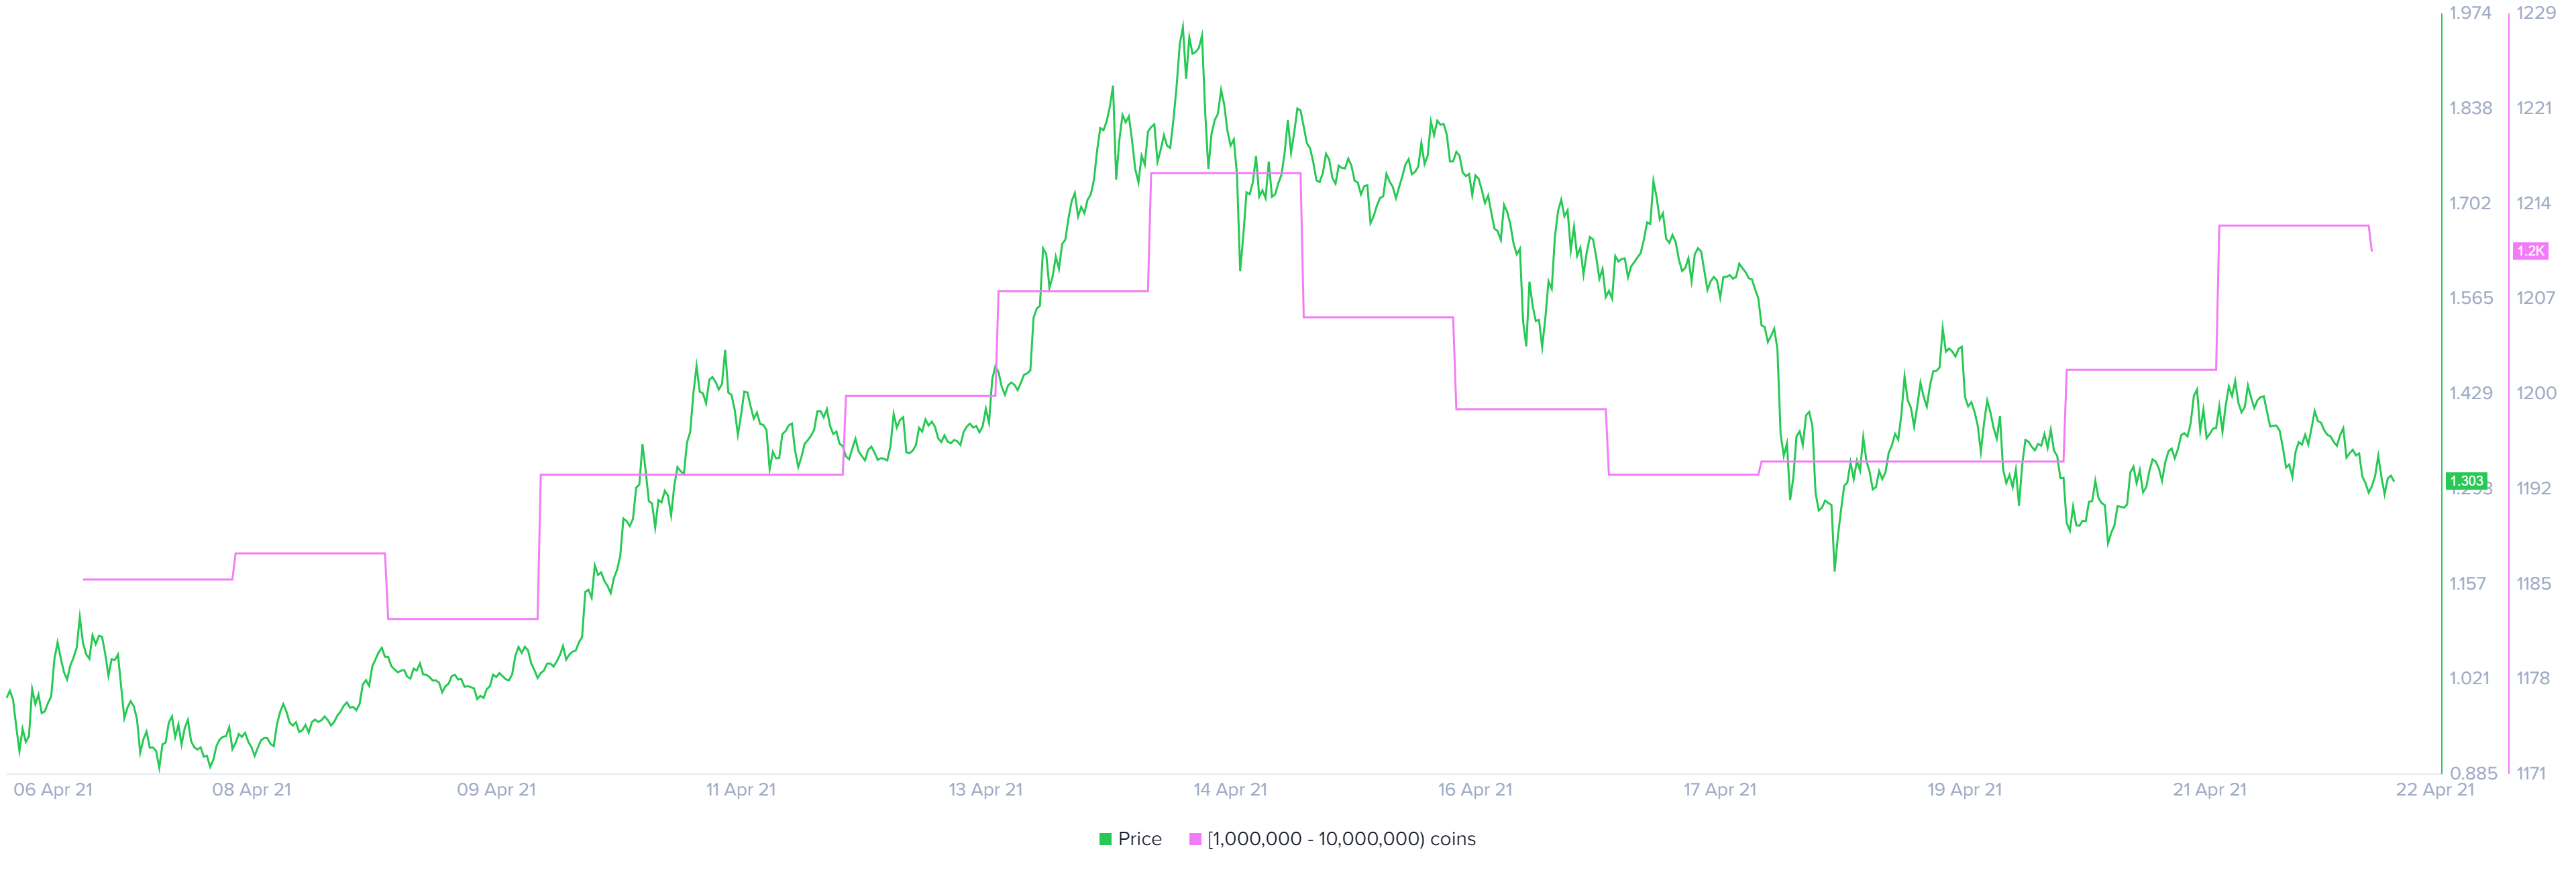
XRP supply distribution chart
The number of daily active addresses transacting on the XRP blockchain has dropped from 49,000 to 29,000 since April 13. This 40% decline suggests that investors are fleeing from the network by reallocating their holdings or booking profits.
Although this slump is bearish, an average of 30,000 addresses interacting with the XRP blockchain suggests that these investors are optimistic about Ripple price despite the recent sell-off.
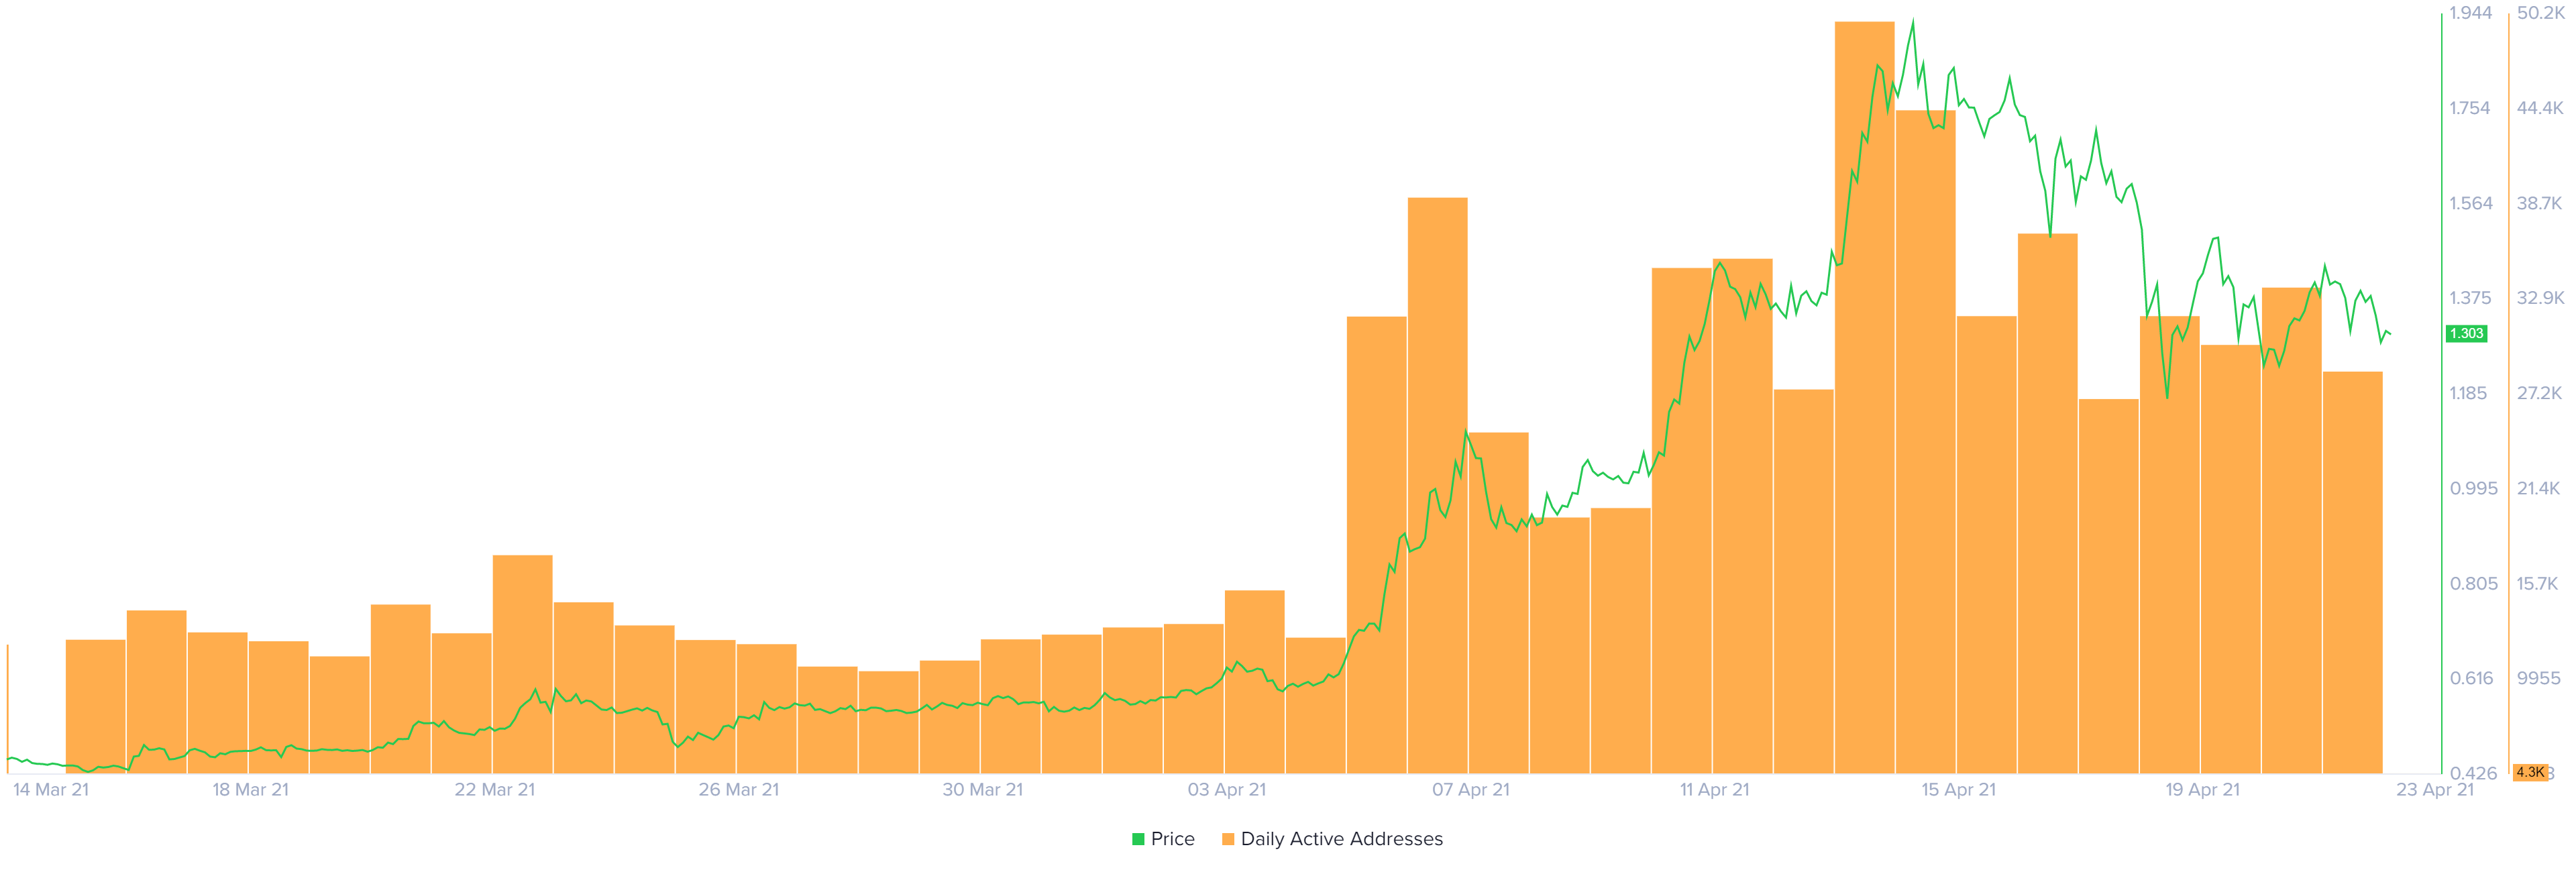
XRP active addresses chart
Regardless of the short-term bearish outlook provided by the technical analysis and some on-chain metrics, a sudden spike in bullish pressure that results in a decisive close above $1.53 will invalidate the bearish thesis.
In such a case, XRP price could surge 30% to retest the local top at $1.96.
Author

Akash Girimath
FXStreet
Akash Girimath is a Mechanical Engineer interested in the chaos of the financial markets. Trying to make sense of this convoluted yet fascinating space, he switched his engineering job to become a crypto reporter and analyst.