Top 3 Price Prediction Bitcoin, Ethereum, Ripple: BTC confirms trend change, while altcoins show impressive gains
- Bitcoin price extends breakout from a falling wedge pattern with an explosive 10% gain.
- Ethereum price is on pace to close with the best six-day gain since the beginning of May.
- XRP price breaks the May descending trend line and tests the robust resistance at the May 23 low of $0.652.

Bitcoin price leads a new charge of strength in the cryptocurrency complex, carrying many digital tokens, including Ethereum and Ripple, above persistent resistance levels and towards a legitimate trend change.
Bitcoin price did endure after balancing close to the abyss
On July 22, Bitcoin price registered a daily close above the falling wedge’s upper resistance line, alerting BTC investors that it was readying for a trend change. The four-day advance since July 22 is 21.52%, marking the best four-day period since the February 11 high of 23.48%.
Since the complete six-day rally began with the successful rebound from $30,000 on July 21, Bitcoin price has rallied 31.58%, logging the best six-day gain since January 7. The BTC move is the second-best six-day performance since June 2019.
With Bitcoin price now above the 50-day simple moving average (SMA), it should continue to rally to a formidable price range defined by the June 15 high of $41,322, the January high of $41,986 and the 38.2% Fibonacci retracement of the April-June correction at $42,589. Residual buying pressure could lift BTC to the 200-day SMA at $44,660, completing a 39% gain from the July 22 daily close above the falling wedge’s upper resistance line.
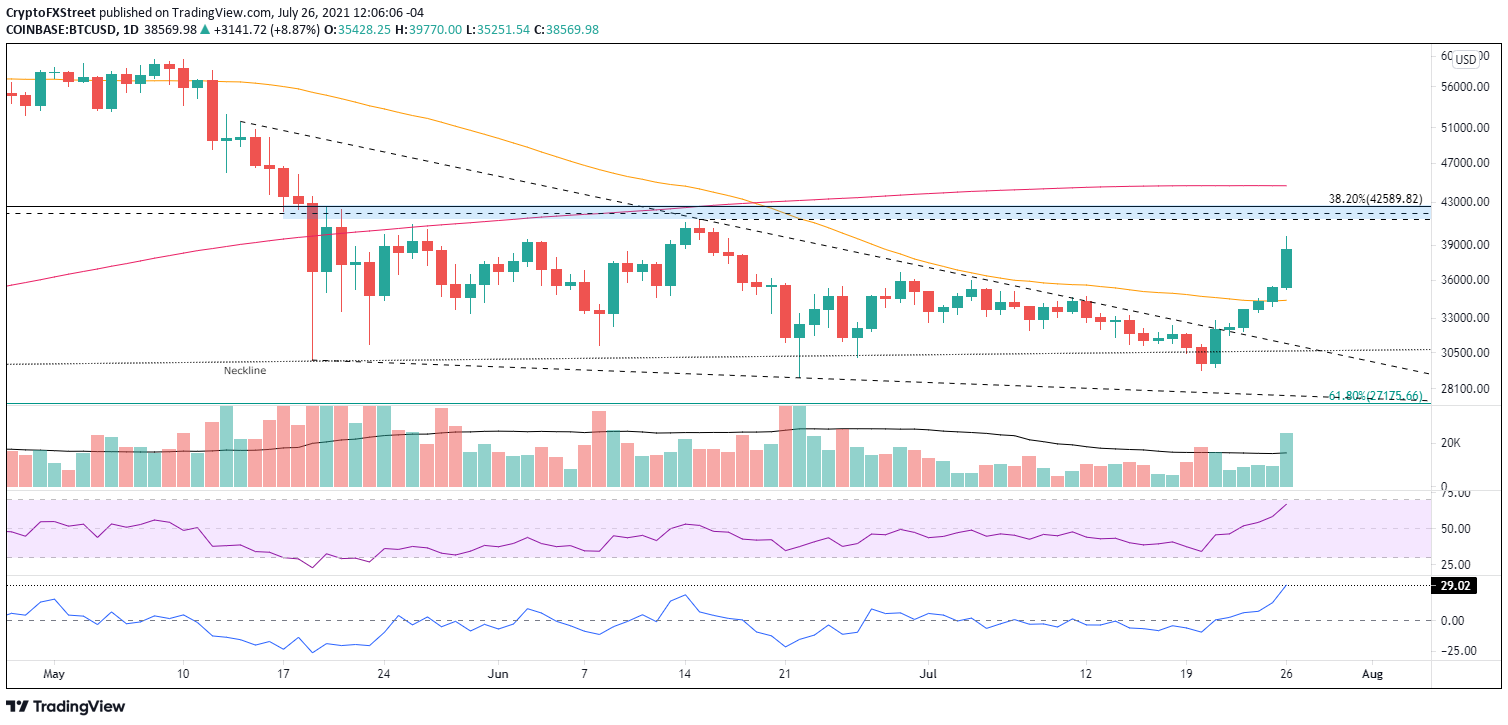
BTC/USD daily chart
The impulsiveness of the rebound over the last six days raises the probability that the correction low was printed back on June 22. Only a collective sell-off in the cryptocurrency complex could undermine the BTC trend change with the 50-day SMA at $34,387 to provide solid support. A failure to hold at the 50-day SMA does interfere with the positive outlook, but only a daily close below the falling wedge’s upper resistance line would void it.
It is important to note that the Bitcoin price rebound originates near the 50-week SMA and the 12-month SMA. The strategic support level was pointed out at the beginning of July in the FXStreet Quarterly Forecast.
Ethereum price proves trend-free markets hold huge opportunities
Ethereum price has been coiling in a descending triangle pattern since the May 23 low, showing no definitive trend while solidifying support along the May 23 low of $1,728 with tests on June 22, June 26 and July 20.
The six-day rebound of 31.6% following the July 20 test of the horizontal support line of the descending triangle marks a trend change for ETH as the smart contracts giant has dissolved the potent resistance offered by the convergence of the 200-day SMA, the 2020 ascending trend line and the 50-day SMA.
Yesterday’s Ethereum price close with a bullish engulfing week on the bar charts was important confirmation that the week holders had been vanquished from ETH, and it was free to test higher prices. Currently, the cryptocurrency is finding resistance near the July 7 high of $2,411. Still, the momentum is sufficient to carry Ethereum price to the triangle’s declining trend line at $2,467, marking a 38% gain from the July 20 close.
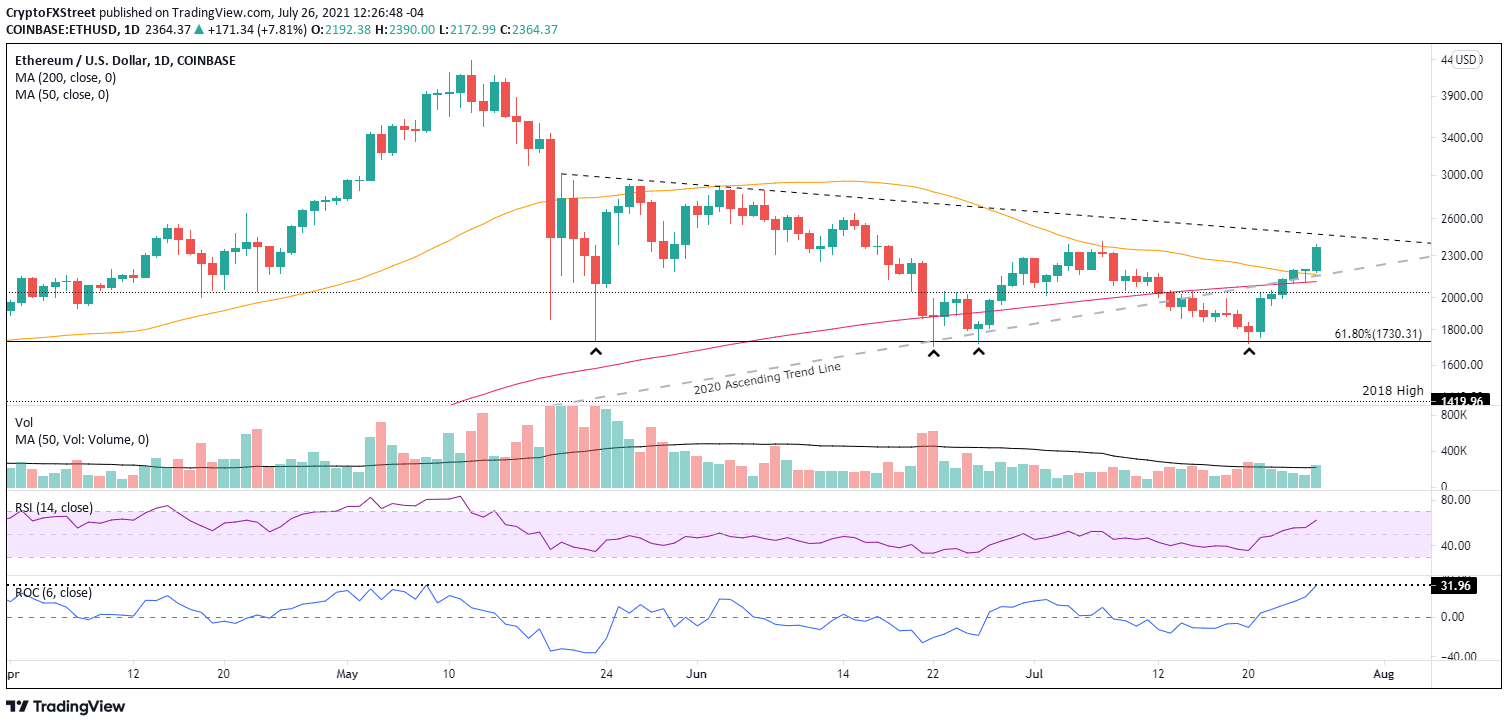
ETH/USD daily chart
Investors should be prepared for some volatility at the July 7 high and, for sure, at the triangle’s declining trend line. As long as Ethereum price holds above the now trifecta of support framed by the 50-day SMA, 2020 ascending trend line and 200-day SMA, ETH is primed for bullish outcomes in the weeks ahead.
ETH proves that compelling opportunities arise from trend-free markets; it is just a matter of evaluating technical levels daily to refine timely entry points to capitalize on the Ethereum price move.
Here, FXStreet's analysts evaluate where ETH could be heading next as it looks primed for higher highs.
XRP price clearing one of the imposing resistance levels
XRP price stabilized above the 50-week SMA at $0.579 and the midline of the descending parallel channel before closing on the May descending trend line yesterday. Today, Ripple is overcoming the resistance of the May 23 low $0.652 and is confronting the next layer of resistance implied by the 50-day SMA at $0.687.
A daily close above the 50-day SMA introduces more resistance, starting at the descending channel’s upper line at $0.715 and then the 200-day SMA at $0.764 and the neckline of a head-and-shoulders pattern going back to 2018 at $0.775. In total, XRP price needs to overcome four more credible resistance levels, requiring a 31% move from yesterday’s close on the May descending trend line, before having a clear road to much higher Ripple prices.
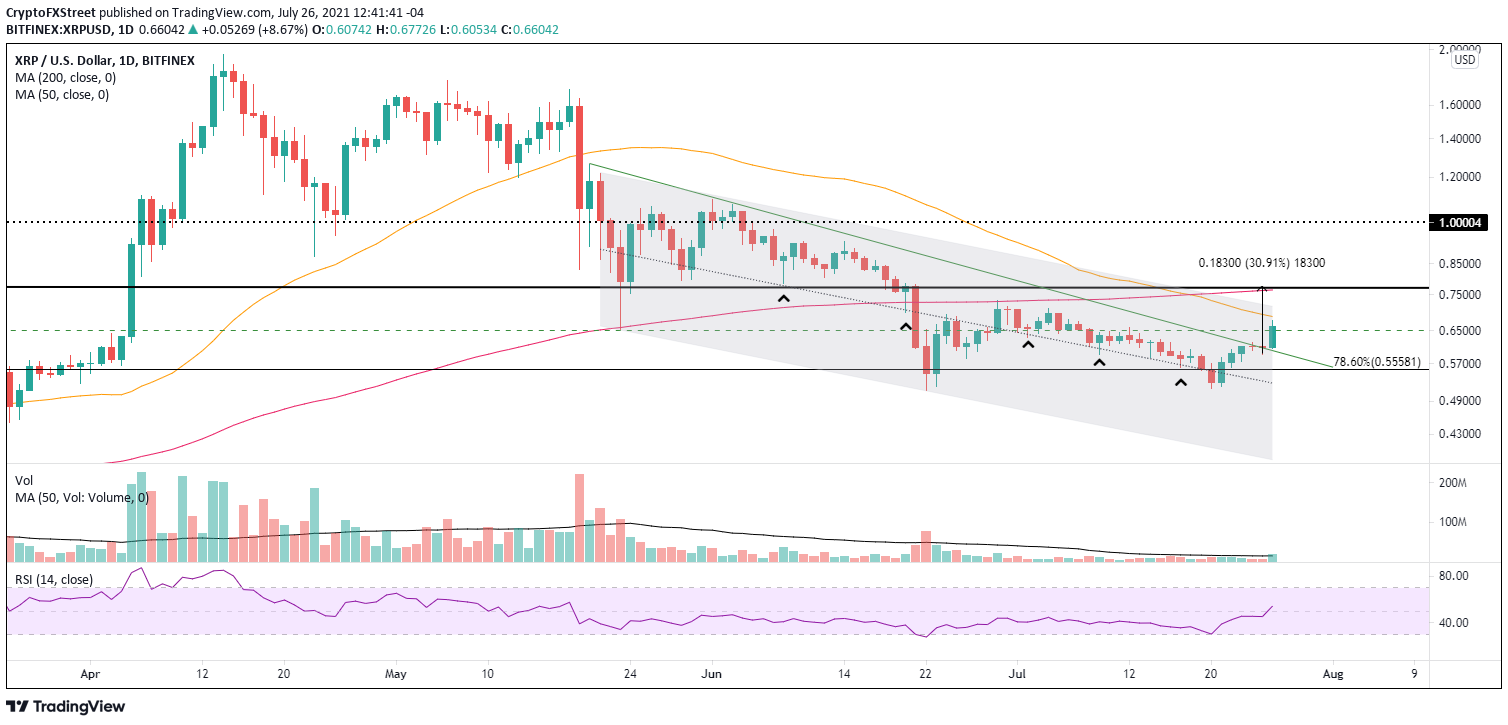
XRP/USD daily chart
XRP price needs to hold the May descending trend line now on pullbacks. A failure to do so would press Ripple down to the 78.6% Fibonacci retracement level at $0.555 and descending channel’s midline at $0.526, effectively voiding the promising trend change.
Here, FXStreet's analysts evaluate where Ripple could be heading next as it faces stiff resistance.
Author

Sheldon McIntyre, CMT
Independent Analyst
Sheldon has 24 years of investment experience holding various positions in companies based in the United States and Chile. His core competencies include BRIC and G-10 equity markets, swing and position trading and technical analysis.


